Point of View
- Who We Serve
- What We Do
- About Us
- Insights & Research
- Who We Serve
- What We Do
- About Us
- Insights & Research
Research
Save to bookmarks
2026 Global Investment Outlook: Resiliency with Complexity
- Portfolio Construction
- Fixed Income Insights
- High Yield Strategy
- Risk Management
Format
Change Format: Choose the format you prefer, and we'll remember your preference next time.
2026 Global Investment Outlook: Resiliency with Complexity
Save to bookmarks
Save to bookmarks
Key Points
What it is
We examine the key themes in 2026 likely to move markets and impact portfolio performance.
Why it matters
Navigating this environment requires a nuanced understanding of shifting correlations, as well as the agility to identify opportunities beyond traditional asset classes.
Where it's going
We believe active management, thoughtful diversification and a focus on fundamentals will drive success.
We enter 2026 after a year of robust global stock gains on AI optimism, falling interest rates and a resilient world economy. Beneath this stability, however, lies a more fragile environment.
Strong fundamentals support equities, but stretched valuations and narrow leadership — especially among AI-driven mega-caps — call for greater selectivity. Passive beta is giving way to strategies focused on quality, value and innovation to navigate late-cycle dynamics and volatility.
Fixed income investors must adapt to a new inflation regime. While inflation seems contained, tail risks persist. Treasury inflation-protected securities (TIPS) offer a useful hedge, and global bonds provide diversification and potential currency benefits as the U.S. dollar faces pressure.
Alternatives are now central to portfolio construction. Liquidity management is critical, with private markets evolving through secondaries, private credit and infrastructure debt. Wide dispersion in manager skill underscores the need for disciplined selection.
This is a market that rewards nuance. Macro calm masks micro turbulence. Active management, thoughtful diversification and a focus on fundamentals, will be essential. The year ahead will test conviction, but also offer opportunity — for those prepared to adapt.
Economic Outlook: Global Momentum Almost Unstoppable
Since the global pandemic, economies around the world have shown tremendous resilience despite a bevy of difficult circumstances. Recession has often felt inevitable, and several nations have barely treaded water. Yet through it all, growth has prevailed.
Risks to the outlook have not diminished and are continually evolving. As we enter 2026, we cannot ignore the risks to the outlook:
Trade Turbulence: Navigating Unsteady Terms
Terms of trade are unsteady. While tariff escalations have diminished, the threat of new U.S. trade restrictions is constant. Global supply chains must now find their course to manage the cost of tariffs through realignment, absorption or passing on to final prices.
AI Goes Mainstream: Proving Its Worth
Artificial intelligence has moved from an emerging to widely-deployed technology. In the year ahead, its developers and adopters will be challenged to demonstrate a return on their investments. AI’s productive potential is significant, but it must meet high expectations.
Labor Market Shake-Up: Uncertainty and Opportunity
Labor markets are in flux. Hiring decisions have been deferred amid high uncertainty. Entry-level workers face the most difficult prospects as they compete not only with other candidates, but also with AI. The year ahead will reveal which sectors grow and which remain challenged.
Inflation’s Lingering Bite: Costs on the Rise
Inflation never entirely cooled; U.S. buyers face risks of higher costs from tariffs still in the pipeline. Higher costs of essentials are diminishing the prospects for lower-income households.
Debt Dilemma: Governments Under Pressure
Governments are in significant debt across developed markets, and most are on track for greater borrowing for years to come. Debts will be serviced, but at higher interest rates, crowding out more productive spending. Higher interest costs will compound inflationary risks.
Momentum Overcomes the Wall of Worries
The wall of worries may feel insurmountable, but this should be a familiar state for most market observers. In nature and in markets, momentum is a potent force. As individuals and as investors, we have all demonstrated our adaptability and resilience through challenges and crises. The year ahead will bring its share of economic surprises.
Forecast: Resilience Drives Growth
Our forecast for the year ahead (Exhibit 1) reflects the resilience of the economy. Policy uncertainty and trade realignment will take their toll, with many nations likely to perform below their potential. However, supportive policies and lower interest rates will compound the economic momentum, allowing markets to continue to avoid recession.
Exhibit 1: The Potent Force of Momentum
Supportive policies and lower interest rates will likely compound the economic momentum, allowing markets to continue to avoid recession.
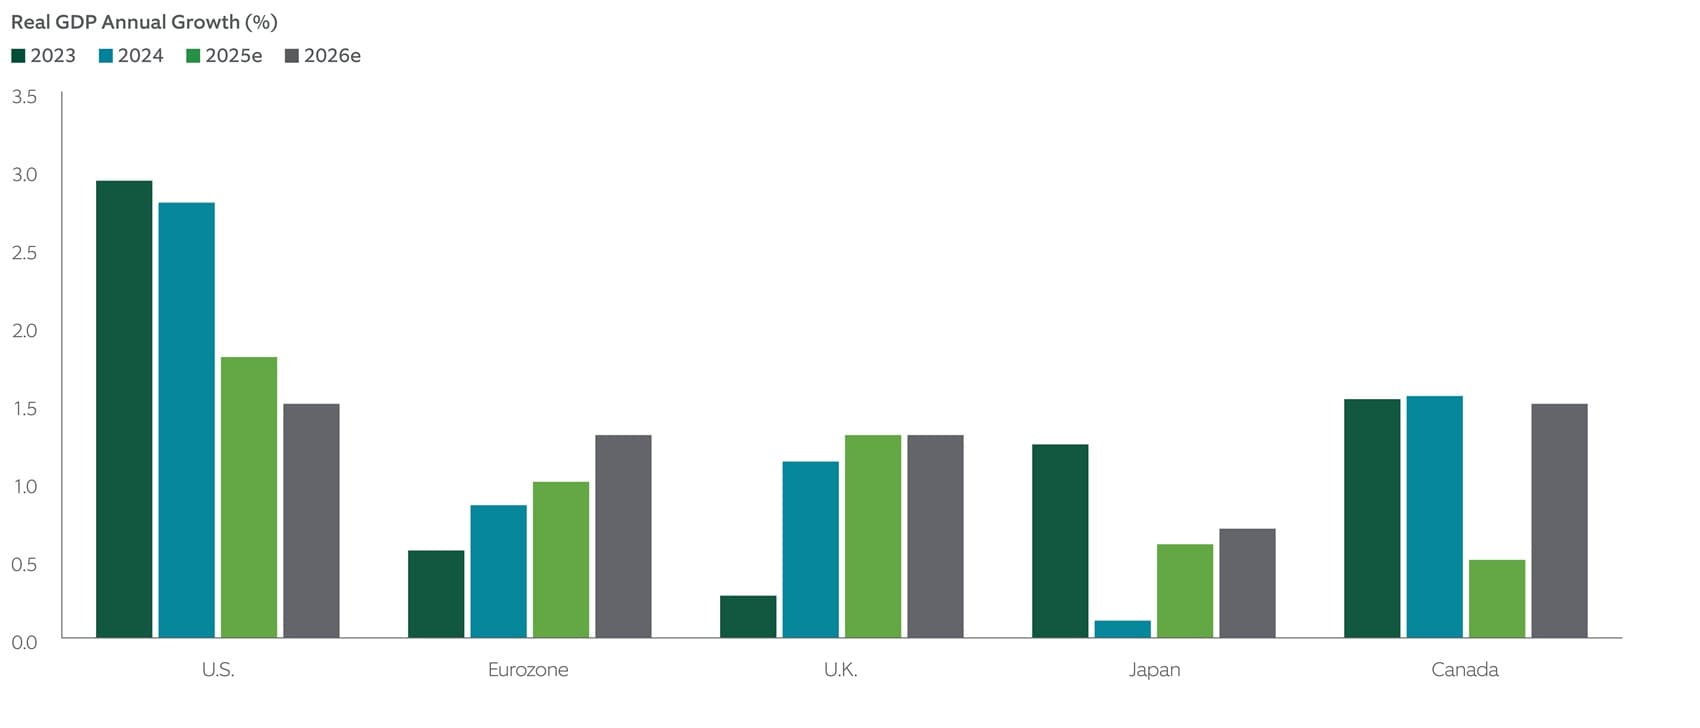
Sources: Northern Trust, Haver Analytics. 2025 and 2026 estimates by Northern Trust are as of November 2025. Historical trends are not predictive of future events.
Market Outlook: Macro Calm, Micro Storm
The contours of the 2026 financial landscape are beginning to firm, revealing a world of structural divergence and a clear mandate for active management. Dependence on momentum from the broad equity rally likely will prove costly.
We prefer equities over bonds. Against a backdrop of emerging macroeconomic stability, the corporate profit growth story is more compelling than the search for yield. Central banks appear to be pivoting, shifting focus from pure inflation-fighting to managing a soft landing, which provides the necessary runway for company earnings to grow.
Positioning for Divergence in Asset Classes
We think the most defining feature of the new year will be increasing divergences within asset classes (Exhibit 2). This is the key reason why the old passive, beta-heavy playbook is changing.
For equities, we are cautious about healthcare. The sector faces another year of regulatory flux in the U.S., with policy changes likely to trigger higher insurance premiums and reduced coverage for a significant portion of the population. Simultaneously, the continued, bumpy shift toward "value-based" care models presents a genuine challenge to legacy business structures. Security selection is key.
AI bolsters the secular case for real assets, especially infrastructure. These assets are a direct beneficiary of long-term investment trends in technology (data centers) and energy transition (renewables, transmission grids). Infrastructure offers resilience and a necessary hedge against inflation that few other asset classes can provide.
In fixed income, credit fundamentals are set to weaken, particularly for highly levered, small-cap U.S. issuers whose thin margins are most exposed to the protracted struggle of the lower-end U.S. consumer.
Furthermore, relying solely on Treasurys for portfolio diversification is a relic of the past decade. A protracted downward pressure on the U.S. dollar, driven by the convergence of global central bank policy and the sheer weight of U.S. deficits and debt, makes the case for broadening the fixed income portfolio. We think global government bonds offer superior diversification benefits and a currency tailwind.
Performance Through Selection
This environment signals that security selection must become a core part of the allocator’s toolkit, demanding a higher allocation to truly active strategies. We believe investors’ ability to distinguish between winners and losers in a fragmented market will generate alpha, not simply mitigate drawdown.
Exhibit 2: Opportunity in Divergence
Lower correlations among U.S. stocks can generate opportunities for alpha through active selection.
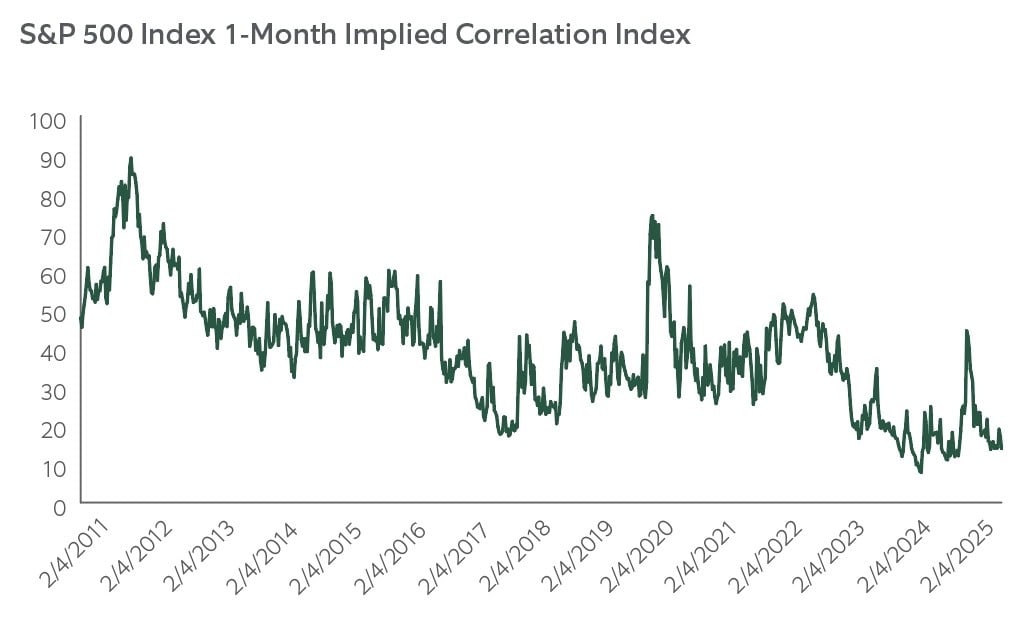
Source: Bloomberg. February 2011 to October 2025. The line represents the Implied Correlation Index, a financial benchmark that provides instantaneous market estimates of expected correlation using implied volatilities of S&P 500 Index and top 50 component options. Historical trends are not predictive of future events.
Inflation in Focus: Navigating Tail Risks and Opportunities
While we expect inflation to remain contained, it continues to run at an above-average rate of about 3%, and there are heightened tail scenarios of inflation running hotter than what is priced into the market.
The Fed’s Balancing Act May Set Up Inflation
In late 2025, the Fed shifted to cutting rates, favoring support of the weakening labor market over their other objective of fighting inflation — even though it is still above their 2% target. We believe this bias toward firing up the economy over inflation-fighting creates more risk that inflation stays above target.
Further, deglobalization, reflected in recent tariffs and tighter immigration policies, can put pressure on prices through goods and wages. As of yet, we have seen muted impact, but this can creep higher over time as these pressures pass through to the final consumer in higher goods and services prices. In addition, there are multiple geopolitical hot spots where flare ups can put pressure on global supply chains.
One offsetting factor for inflation is the AI expansion which can lead to productivity gains and offset labor pressures. Yet, required infrastructure, including increased energy, water and other materials, needed to fuel AI expansion can put pressure on supply chains.
Unusual Environments Create Opportunity
Historically, traditional bonds have been the best asset class for managing the risk of deflation or declining growth. Going forward, with heightened tail risk to inflation, one would expect the market to put a premium on inflation-protected securities like Treasury inflation-protection securities (TIPS), since they return the greater of inflation-adjusted principal or par value at maturity.
Yet, this is not the case. Exhibit 3 shows the split of Treasury yields between real rates and the breakeven rate, the inflation rate where investors are indifferent between owning TIPS or similar maturity Treasurys. The five-year and 10-year breakeven is at 2.45% and 2.37%, respectively. If inflation continues at the 3% level or higher, TIPS investors are better off.
As Exhibit 3 shows, TIPS as of September 30 were not pricing much of a premium given current inflation is running higher than the breakeven rate, creating a potential opportunity for fixed income investors looking for long-term inflation protection.
Exhibit 3: Breakeven and Inflation Mismatch
If inflation remains at 3% or higher, then the lower breakeven rates shown below signal an opportunity for TIPS investors.
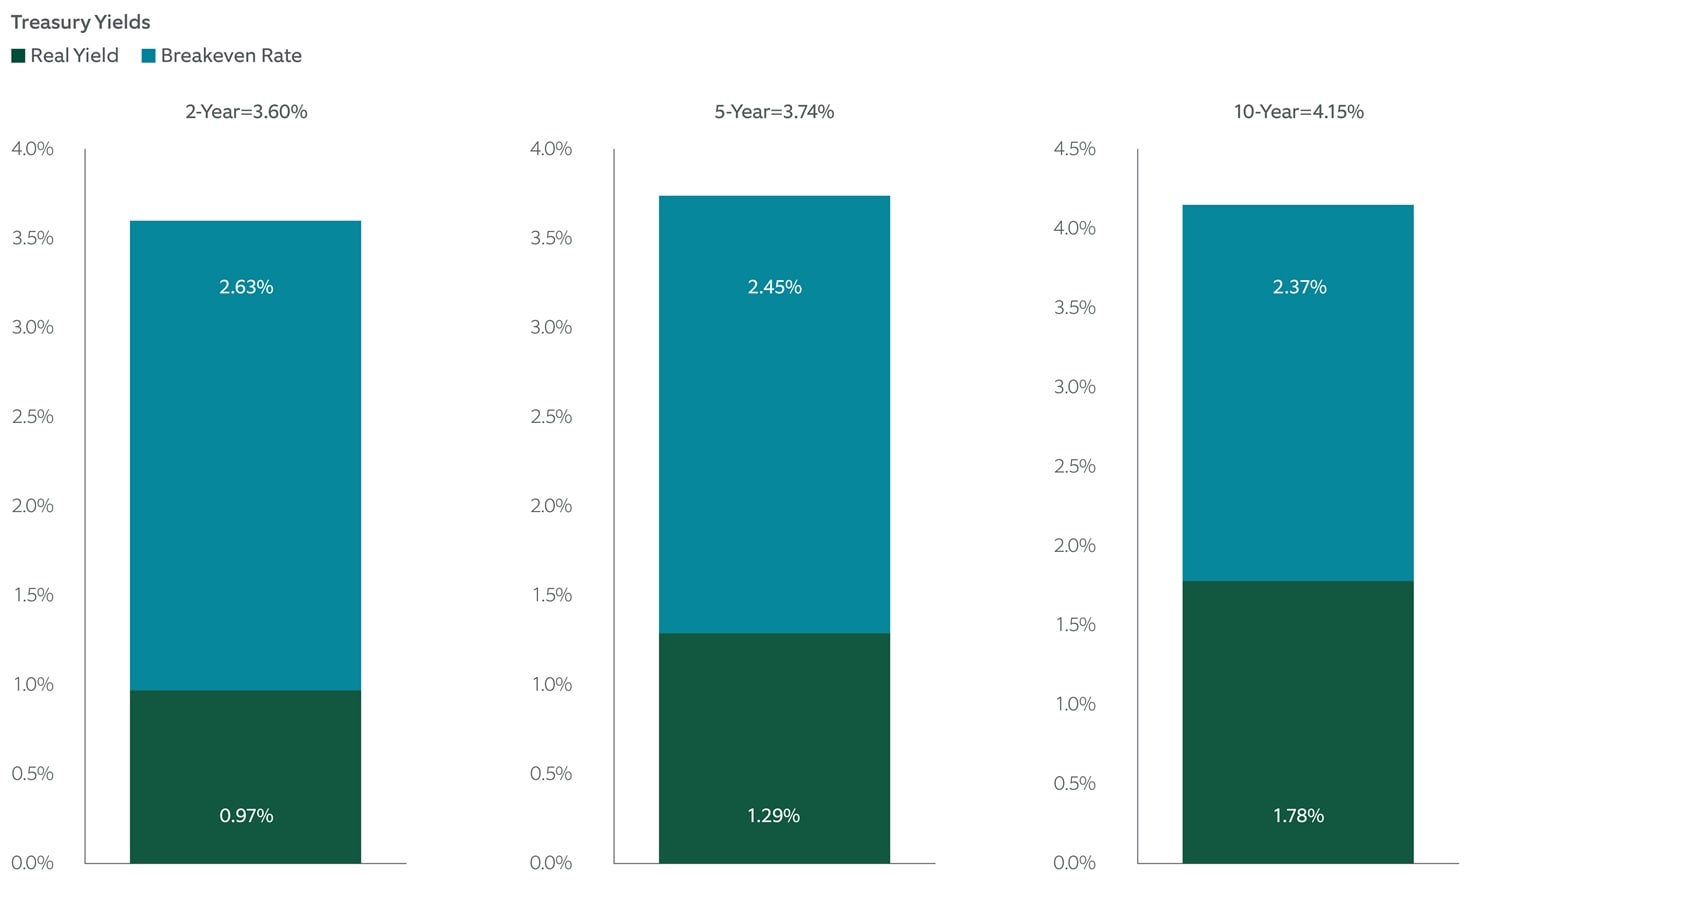
Source: Bloomberg, data as of September 30, 2025. Historical trends are not indicative of future results.
Private Credit: Resilience, Reinvention and Room to Run
Private credit enters 2026 with momentum, even as macroeconomic challenges and tighter spreads persist. Forecasts suggest the asset class could surpass $5 trillion by 2029, underscoring its durability and appeal.1 While direct lending remains dominant, asset managers are increasingly diversifying into niche strategies like asset-based finance, infrastructure debt and special situations.
Shifting Borrower Behavior
Regulatory constraints on traditional banks and a slower merger-and-acquisition environment are driving borrowers toward private credit for its speed, flexibility and customization. At the same time, retail and insurance capital pools are emerging as significant funding sources, expanding the investor base and deepening market liquidity.
Structural Innovation
Fund structures are evolving to meet investor needs. Evergreen vehicles and continuation funds are gaining traction, offering solutions to liquidity constraints and demand for flexibility. The rise of evergreen structures is particularly notable, with growth expected to continue into 2026.
Performance Outlook
Senior direct lending strategies are poised to deliver resilient returns, supported by elevated yields and strong borrower fundamentals. The illiquidity premium continues to drive outperformance versus public markets and liquid alternatives. Since 2000, private credit funds have outperformed their public market equivalents by an average of 3.2% annually, a trend expected to persist.2
Dry Powder Dynamics
Private equity buyout dry powder still far exceeds that of direct lending (Exhibit 4), suggesting ample runway for growth in private credit. This imbalance highlights the opportunity for direct lenders to continue to grow market share and drive higher origination volume.
Exhibit 4: Ample Runway for Private Credit Growth
Private equity buyout dry powder still far exceeds that of direct lending, suggesting ample runway for growth in private credit.
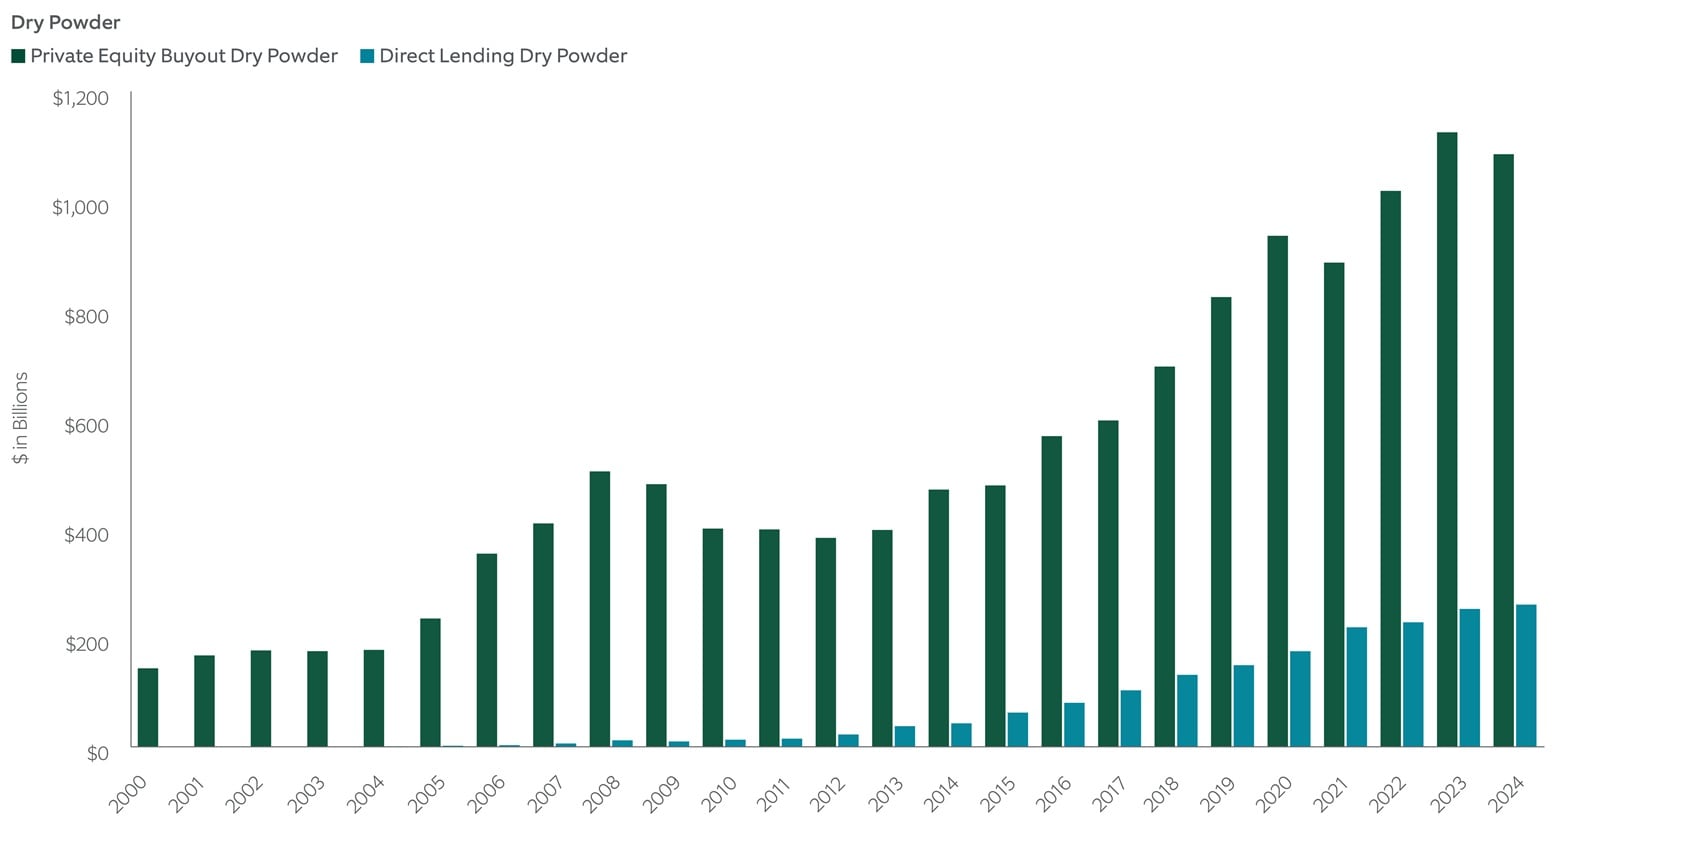
Source: Preqin, as of October 2025. Historical trends are not predictive of future events.
High Yield: Stability, Selectivity and Strategic Shifts
As we approach 2026, the macro backdrop for credit markets is broadly constructive. Expectations for Federal Reserve easing, potential fiscal stimulus, and a stable economic environment are setting the stage for continued resilience across fixed income. Credit losses are projected to remain below long-term averages, supported by steady fundamentals and disciplined corporate behavior.
Fixed Income Positioning in a Lower Rate Environment
Within the broader credit landscape, fixed-rate instruments are well positioned to benefit from a declining rate environment. This dynamic has already begun to play out, with fixed-rate credit like high yield outperforming floating-rate segments such as leveraged loans in 2025.3 As policy rates move lower, duration exposure may become a more meaningful driver of relative performance.
Defaults and Recoveries: A Constructive Year
Default rates are expected to remain below historical norms (Exhibit 5), aided by supportive policy and economic conditions. Recovery rates have been elevated, driven by liability management exercises (LMEs) that offer more favorable outcomes than traditional bankruptcies. These trends suggest that expected credit loss over the next year will be relatively modest.
Fundamentals and the Role of Active Management
Corporate fundamentals remain solid, with earnings growth expected to support stable leverage and improving interest coverage. Issuers with floating-rate debt stand to benefit from declining base rates, while refinancing activity may further enhance balance sheet flexibility. However, dispersion within credit quality — particularly among lower-rated issuers — underscores the importance of security selection and active management in navigating potential risks.
Thematic Momentum: AI Infrastructure and Credit Demand
One emerging theme is the role of credit markets in funding AI infrastructure. Over the past year, seasoned issuers have tapped demand tied to power, data centers and related technologies. This trend is expected to accelerate in 2026, with new entrants raising capital to support growth initiatives in digital infrastructure. Credit markets are increasingly serving as a strategic financing channel for innovation-driven sectors.
Exhibit 5: Supportive Conditions for Low Defaults
Default rates are expected to remain below historical norms, aided by supportive policy and economic conditions.
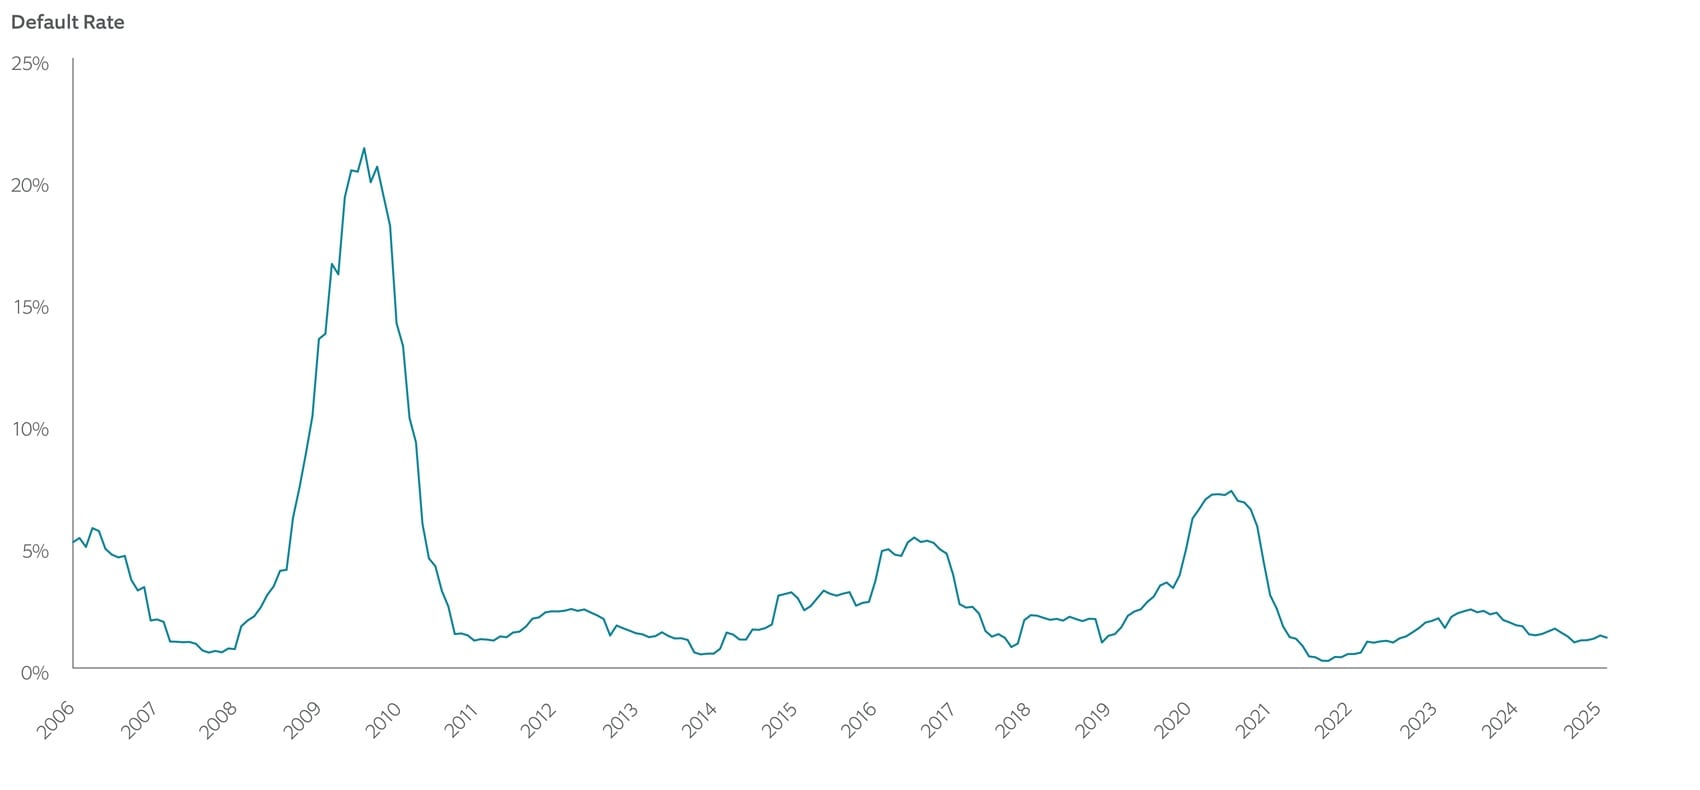
Source: BofA Global Research, from December 31, 2005 to September 30, 2025. Historical trends are not predictive of future events.
Alternatives: The Battle for Liquidity
The landscape for multi-asset portfolios is undergoing a profound transformation. Traditional diversification benefits from stocks and bonds have diminished, as evidenced by rising correlations over the past decade. Traditional private equity buyout, growth and venture capital funds have also lagged public markets since 2022 . This shift is prompting investors to look beyond conventional assets and evolve their approach to portfolio construction with alternatives.
Liquidity Management: Central to Portfolio Design
Liquidity isn’t a free lunch — in 2026, investors will need to manage and integrate liquidity costs with more precision. Despite optimism in mid-2025 about a rebounding initial public offering (IPO) market, exit activity was limited, with only a few notable tech names making headlines. The aging issue in private equity persists, with over 12,000 U.S. companies in inventory and a projected seven-year exit backlog.
Investors are responding by adopting diversified liquidity solutions through use of limited-partner-led secondaries as a strategic tool and private credit to generate cash flows for funding commitments or participation in new vintages. The distinction between liquid and illiquid assets is shifting, with growth in secondaries, improved data transparency and new fund structures driving a more nuanced approach to liquidity across the public-private spectrum.
Redefining Alpha in Alternatives
With global alternatives assets projected to reach $32 trillion by 2030,4 dispersion in manager skill and strategy complexity will continue to drive varied outcomes for investors. In private equity, operational excellence — especially in mid- and lower-middle market strategies — will be key to generating alpha, as higher neutral interest rates shift the focus to profit growth. Private credit is evolving, with tight spreads making direct lending less attractive and return potential shifting to more complex strategies such as asset-backed finance, distressed credit, and real estate debt. Within private infrastructure, moderating inflation and geopolitical uncertainty will challenge core strategies, driving investors to value-add and mid-market opportunities in digital and energy infrastructure.
Sourcing Differentiated and Less Crowded Opportunities
Alternatives offer access to exposures tied to macroeconomic and fiscal policy dynamics, as well as structural shifts driven by AI and deglobalization. While these shifts can drive industry transformations and future enterprise value creation, investors must be discerning with a focus on entry valuations and pace of AI adoption (Exhibit 6). In 2026, we believe investors will seek opportunities across the value chain beyond traditional private equity or venture capital to identify and unlock undervalued assets and enhance portfolio diversification.
Exhibit 6: Rethinking Venture Capital Diversification
Venture capital is increasingly concentrated, with AI-related deals accounting for 64% of activity, up from under 10% a decade ago.
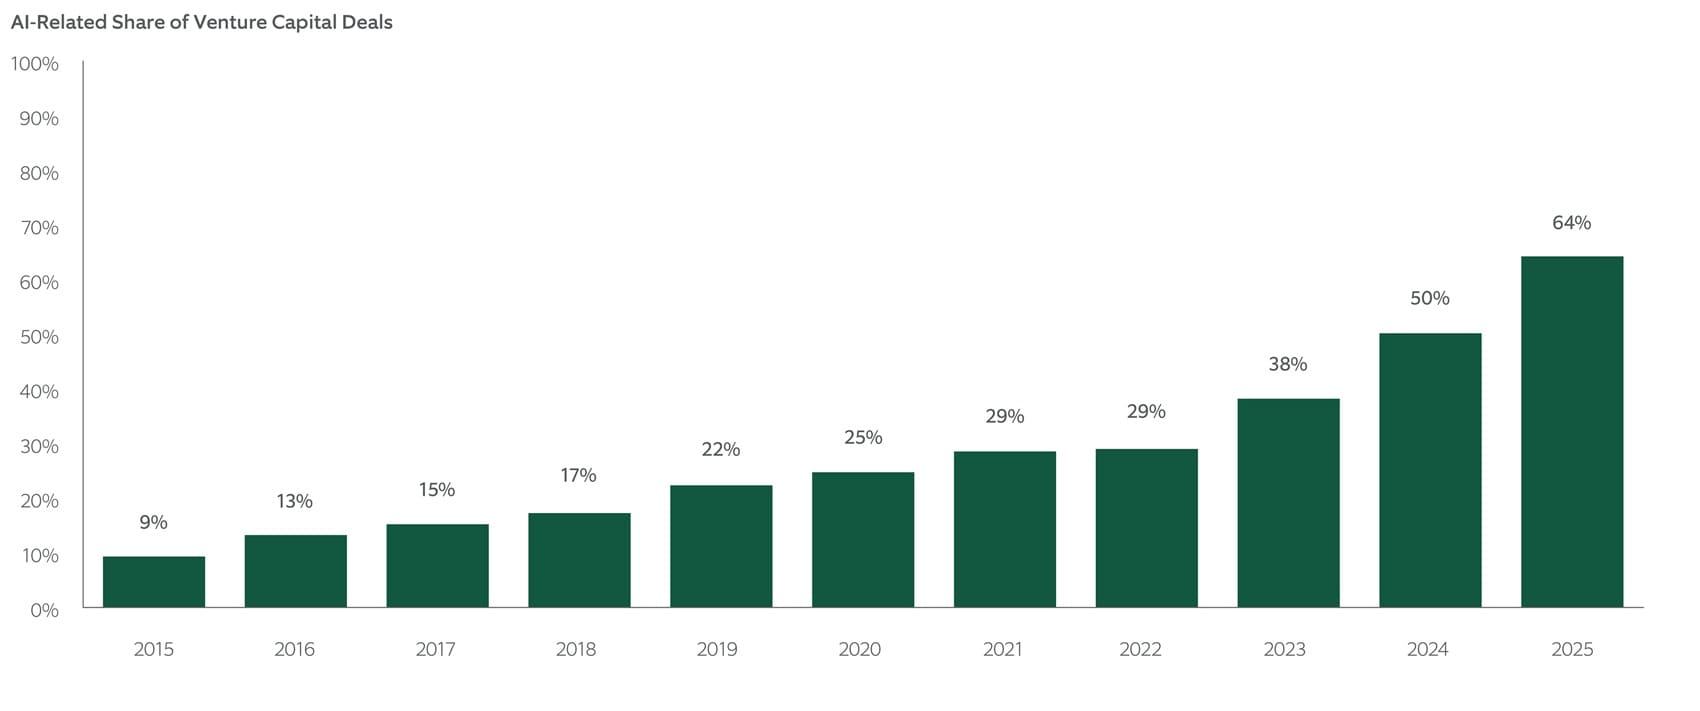
Source: Pitchbook, as of September 30, 2025. Historical trends are not predictive of future events.
U.S. Equities: Beyond the AI Boom
U.S. equity markets head into 2026 after three years of robust gains, fueled by AI-driven enthusiasm, resilient corporate earnings and expanding valuation multiples. While these tailwinds have pushed indexes to new highs, they’ve also been accompanied by heightened geopolitical risk and episodic volatility.
While technology spending remains a secular growth driver, valuation discipline is increasingly critical because mega-cap growth multiples have pulled away from the pack. Even AI is not immune to cyclical pressures, and with below-trend economic growth expected, investors may benefit from a more selective approach. Rising volatility and heightened sensitivity to AI sentiment may favor companies with strong profitability, prudent capital management, and reasonable valuations — hallmarks of the quality and value equity factors. Defensive sectors may also offer resilience in what could be another choppy year.
Navigating Narrow Leadership
Recent market performance leadership continues to be concentrated in a few mega-cap and AI-linked names. It is difficult to say how sustainable this is, but with concentration in the S&P 500 at record levels, investors may seek to prioritize diversification of exposures. Expectations for continued Fed easing could be a tailwind for markets overall — including tech leaders — should the current “soft landing” mixture of modest inflation and positive but below trend economic growth persist into 2026. However, should leadership broaden in line with historical norms, other areas of the market may benefit.
In this context, a pivot toward companies with durable fundamentals and attractive valuations appears timely. Historically, the quality and value (quality as defined by profitability and capital discipline, and value as defined by relatively low multiples) have outperformed in economic slowdowns and lower-return environments (Exhibit 7). Today, with value trading at favorable levels relative to its historical average relative to growth, these segments offer a potential anchor for portfolios amid shifting market dynamics.
Defensive Positioning for Uncertain Times
Low volatility stocks also deserve renewed attention. In 2025, markets experienced sharp drawdowns tied to events like DeepSeek and Liberation Day, during which low-volatility equities provided meaningful downside protection. With uncertainty likely to persist — driven by both known and unforeseen risks — stocks with lower risk profiles and higher quality characteristics may continue to serve as portfolio shock absorbers, while still participating in upside.
In an environment marked by elevated valuations, episodic volatility, and speculative narratives, a renewed focus on valuation sensitivity and portfolio defensiveness is warranted. For 2026, we believe quality, value, and low-volatility exposures can help advisors position client portfolios for resilience and long-term success.
Exhibit 7: Portfolio Defensiveness
Speculative narratives, elevated valuations and episodic volatility in 2026 may justify portfolio exposures to quality, value and low-volatility factors.
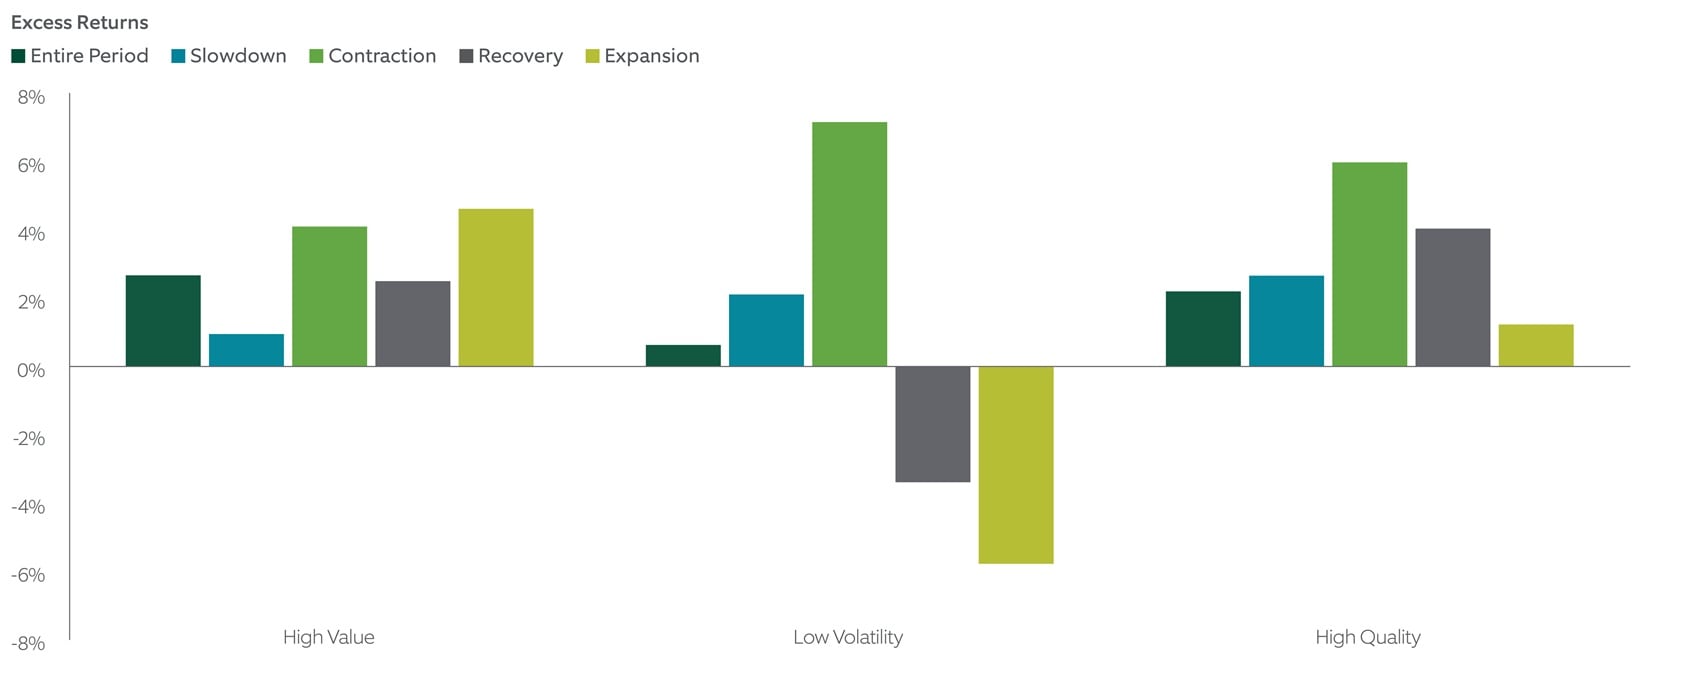
Source: For illustrative purposes only. NTAM Quantitative Research, Bloomberg. Entire period = January 1, 1984 – September 30, 2025. Note: Russell 1000 Index data is shown. Factor returns are excess returns of the equal weighted top quintiles of MSCI Barra Factors over the Russell 1000 returns. Geometric averages used for entire period. For regime analysis, annual averages are displayed.. Please see important information on Hypothetical Returns at the end of this presentation. Past performance is no guarantee of future results. Index performance returns do not reflect any management fees, transaction costs or expenses. It is not possible to invest directly in any index. Historical trends are not predictive of future events.
1 PitchBook, as of May 2025
2 eVestment and Cambridge Associates as of March 31, 2025
3 Source: Bloomberg, from December 31, 2024 to November 10, 2025.
4 Preqin Private Markets in 2030 Report, October 2025
Main Point
Navigating Complexity in 2026
In 2026, resilient markets mask underlying complexity. We believe investors should consider selectivity, private markets and active management to navigate uncertain markets.

Contact Us
Interested in learning more about our expertise and how we can help?
Beta: A beta investment means a portfolio or investment has the same risk as the market, as represented by a chosen market index.
Correlations: Correlation is the extent of which two securities move with each other, where highly correlated securities have similar return patterns. Low correlation between securities often contributes to diversification, a way to lower portfolio risk.
Direct lending: Direct lending is a type of private credit strategy in which the strategy makes privately negotiated loans directly to businesses.
Dry powder: The amount of unspent capital investors have that's waiting to be invested, usually into private investments.
Excess Returns: The return over a benchmark or market.
Initial Public Offering: The initial public stock issuance by a formerly private company.
Limited partner: Limited partners provide capital for private funds.
Private credit: Private credit investors loan money to companies that may have trouble obtaining bank loans or raising debt on the public market. They can offer relatively attractive returns versus other debt, but they also can be more illiquid and risky.
Private equity buyout fund: Private equity buyout funds typically purchase public, mature companies with the intent of making their operations more efficient and later selling them at a profit through IPOs.
{{russell_1000_index}}
{{sp_500_index}}
Valuation multiples: Valuation multiples are financial metrics used to compare a company's stock price to its financial performance or other relevant factors, aiding in assessing relative valuation and making informed investment decisions.
Venture capital fund: These fund provide equity financing to new or growing private companies.
Northern Trust Asset Management
Northern Trust Asset Management is a global investment manager that helps investors navigate changing market environments in efforts to realize their long-term objectives.
Entrusted with {{aum_value}} in assets,* we understand that investing ultimately serves a greater purpose and believe investors should be compensated for the risks they take — in all market environments and any investment strategy. That’s why we combine robust capital markets research, expert portfolio construction and comprehensive risk management in an effort to craft innovative and efficient solutions that seek to deliver targeted investment outcomes.
As engaged contributors to our communities, we consider it a great privilege to serve our investors and our communities with integrity, respect, and transparency.
*as of {{as_of_date}}
IMPORTANT INFORMATION
Northern Trust Asset Management is composed of Northern Trust Investments, Inc., Northern Trust Global Investments Limited, Northern Trust Fund Managers (Ireland) Limited, Northern Trust Global Investments Japan, K.K., NT Global Advisors, Inc., 50 South Capital Advisors, LLC, Northern Trust Asset Management Australia Pty Ltd, and investment personnel of The Northern Trust Company of Hong Kong Limited and The Northern Trust Company.
Issued in the United Kingdom by Northern Trust Global Investments Limited, issued in the European Economic Association (“EEA”) by Northern Trust Fund Managers (Ireland) Limited, issued in Australia by Northern Trust Asset Management (Australia) Limited (ACN 648 476 019) which holds an Australian Financial Services Licence (License Number: 529895) and is regulated by the Australian Securities and Investments Commission (ASIC), and issued in Hong Kong by The Northern Trust Company of Hong Kong Limited which is regulated by the Hong Kong Securities and Futures Commission.
For Canada, Asia-Pacific (APAC) and Europe, Middle East and Africa (EMEA) markets, this information is directed to institutional, professional and wholesale clients or investors only and should not be relied upon by retail clients or investors. For U.S. NTAM, the information contained herein is intended for use with all current or prospective clients of Northern Trust Investments, Inc (NTI).
This content may not be edited, altered, revised, paraphrased, or otherwise modified without the prior written permission of Northern Trust Asset Management (NTAM). The information contained herein is intended for use with current or prospective clients of Northern Trust Investments, Inc (NTI) or its affiliates. The information is not intended for distribution or use by any person in any jurisdiction where such distribution would be contrary to local law or regulation. NTAM and its affiliates may have positions in and may effect transactions in the markets, contracts and related investments different than described in this information. This information is obtained from sources believed to be reliable, its accuracy and completeness are not guaranteed, and is subject to change. Information does not constitute a recommendation of any investment strategy, is not intended as investment advice and does not take into account all the circumstances of each investor.
This report is provided for informational purposes only and is not intended to be, and should not be construed as, an offer, solicitation or recommendation with respect to any transaction and should not be treated as legal advice, investment advice or tax advice. Recipients should not rely upon this information as a substitute for obtaining specific legal or tax advice from their own professional legal or tax advisors. References to specific securities and their issuers are for illustrative purposes only and are not intended and should not be interpreted as recommendations to purchase or sell such securities. Indices and trademarks are the property of their respective owners. Information is subject to change based on market or other conditions.
Past performance is not a guarantee of future results. Performance returns and the principal value of an investment will fluctuate. Performance returns contained herein are subject to revision by NTAM. Comparative indices shown are provided as an indication of the performance of a particular segment of the capital markets and/or alternative strategies in general. Index performance returns do not reflect any management fees, transaction costs or expenses. It is not possible to invest directly in any index. Net performance returns are reduced by investment management fees and other expenses relating to the management of the account. Gross performance returns contained herein include reinvestment of dividends and other earnings, transaction costs, and all fees and expenses other than investment management fees, unless indicated otherwise. For U.S. NTI prospects or clients, please refer to Part 2a of the Form ADV or consult an NTI representative for additional information on fees.
Unless otherwise noted, the statements expressed herein are solely opinions of Northern Trust. Northern Trust does not make any representation, assurance, or other promise as to the accuracy, impact, or potential occurrence of any events or outcomes expressed in such opinions.
Forward-looking statements and assumptions are NTAM’s current estimates or expectations of future events or future results based upon proprietary research and should not be construed as an estimate or promise of results that a portfolio may achieve. Actual results could differ materially from the results indicated by this information. Historical trends are not predictive of future results.
Not FDIC insured | May lose value | No bank guarantee