The Weekender
- Who We Serve
- What We Do
- About Us
- Insights & Research
- Who We Serve
- What We Do
- About Us
- Insights & Research
Investment Perspective · 06.25.26
Save to bookmarks
Is AI Inflationary or Deflationary?
AI may lower prices long term, but today’s surge in investment is straining supply—posing a near-term inflation challenge for markets and the Fed.
- Volatility & Risk
- Multi-Asset Insights
- Markets & Economy
Key Points
AI investment is colliding with constrained supply—raising costs in chips, power, construction and skilled labor, and adding to near-term inflation pressure.
Policymakers may need to lean against this demand by keeping rates higher to prevent second-round inflation and maintain credibility.
AI may still prove disinflationary over time, but investors should prepare for the inflationary cost of building it first.
The AI boom goes from strength to strength. Big technology companies are pouring hundreds of billions of dollars into chips, data centers and power-hungry infrastructure. One estimate puts annual AI infrastructure investment above $650 billion in 2025 and potentially over $800 billion in 2026. Meanwhile, SpaceX's record initial public offering (IPO) — raising about $75 billion and valuing the company near $1.75 trillion at issue — is a useful reminder that capital markets remain wide open for anything with a plausible claim on the AI future.
That creates an awkward problem for the Federal Reserve (Fed). AI may be a long-run productivity miracle. But the short-run impulse looks less like disinflation and more like a classic investment boom colliding with limited supply. Semiconductors are scarce and used in almost all industrial goods. Electric grids are constrained. Construction costs are rising. Land, labor, copper, turbines and transformers are not infinitely elastic. Data centers may be digital assets in the long run, but they require very physical inputs.
Some Fed officials have already expressed concern that these pressures could complicate the inflation outlook. The concern is not simply that Nvidia chips cost more. It is that the AI build-out touches several sticky categories at once: equipment, electricity, commercial construction, skilled labor and financial conditions. Add buoyant equity markets and robust IPO demand, and the Fed must also consider whether asset-price inflation is loosening conditions even as policy rates remain restrictive.
This is where the new Fed chair, Kevin Warsh, matters. Having chaired his first Federal Open Market Committee (FOMC) meeting last week, Warsh has already signaled that the central bank's inflation framework needs updating, including greater attention to trimmed or underlying inflation measures rather than simply relying on core (PCE). At his Senate hearing, Warsh said he wants to understand "the underlying inflation rate" and whether shocks are creating second-round effects. After several years of overshooting the 2 percent target, the Federal Reserve's institutional credibility is no longer free.
The numbers could force the issue. If AI-related demand adds as much as 0.5 percentage points to core inflation over the coming year, policymakers cannot easily look through it. A credible central bank may need to lean against the boom by keeping rates higher, slowing credit growth, and tightening financial conditions enough to cool the most speculative parts of the cycle.
The complication is that AI may still be deflationary in the end. If it replaces labor, compresses wages and raises productivity, today's inflationary capital expenditure (capex) surge may be tomorrow's disinflationary supply shock. The Fed's task is therefore not to decide whether AI is good or bad. It is to decide which horizon matters.
With inflation data firming and Warsh promising to restore credibility, the debate is likely to intensify. AI may yet lower prices. But first it must work through the inflationary cost of building itself.
— Peter Wilke, CFA – Head of Tactical Asset Allocation, Global Asset Allocation
THE HYPERSCALER CAPEX BOOM – NOW VISIBLE IN NATIONAL ACCOUNTS
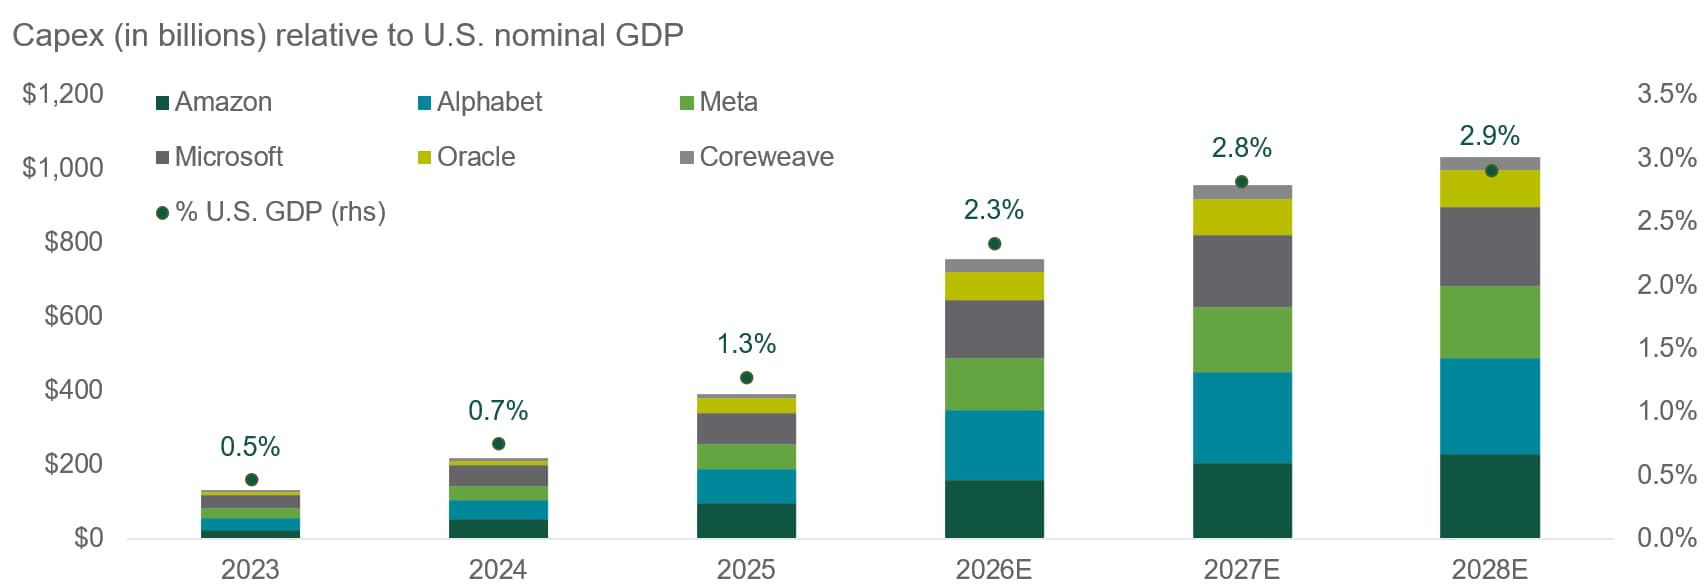
Source: Northern Trust Asset Management, Bloomberg. Capital expenditure reflects reported actuals for 2023–2025 and Bloomberg consensus estimates for 2026–2028. Amazon represented by AWS only. Coreweave reflects available reported and estimated data from IPO onwards. Historical trends are not predictive of future results.
Interest Rates
Repo rates have continued to trend lower within the Federal Reserve’s target range since 4Q 2025, reflecting evolving reserve conditions and policy implementation dynamics. The Treasury General Collateral Rate (TGCR) traded near the lower bound in May, a notable shift from as early as December, when rates were elevated and, at times, above the upper bound. This evolution is consistent with our prior expectation that Reserve Management Purchases (RMPs) of would place downward pressure on repo and other money market rates.
Alongside RMPs, money market fund inflows have further softened repo conditions by increasing demand for short-term collateralized investments. While the Federal Reserve has recently reduced the pace of RMPs to $10 billion per month, the cumulative impact of prior purchases continues to support repo and T-bill markets. As a result, fourth quarter funding pressures have calmed meaningfully.
We expect money market rates to remain broadly range bound, centered around the middle to lower half of the target range, anchored by the balance of reserve supply and demand alongside sustained T-bill demand.
— Dan LaRocco, Head of U.S. Liquidity, Global Fixed Income
TOP TO BOTTOM
Repo rates have been trading near the lower bound.
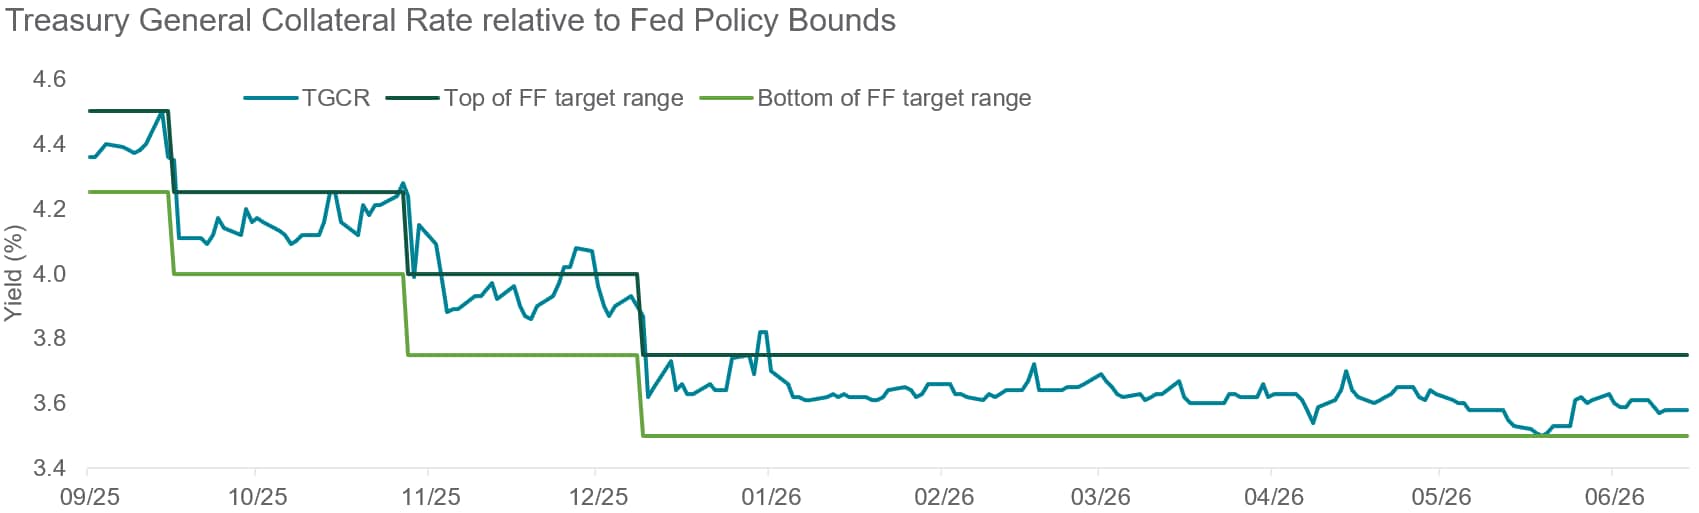
Source: Northern Trust Asset Management, Bloomberg. Data as of 6/12/2026. Historical trends are not predictive of future results.
- Repo rates have declined meaningfully, with TGCR recently trading near the lower bound of the target range.
- RMPs and money fund inflows have contributed to lower repo and money market rates.
- Looking ahead, we expect rates to remain range bound, skewed toward the middle to lower half of the target range.
Credit Markets
Risk assets continued to perform well in May, even against a backdrop of rising interest rates and geopolitical volatility. The gained 5.3% for the month, capping one of its best two-month periods in history. Evolving monetary policy expectations and inflation concerns drove a repricing of Treasuries, pushing yields higher across the curve. Credit markets generated solid returns, driven by coupon income, with the high yield bond market gaining 0.5% as spread tightening offset the drag from rising Treasury yields.
The distressed universe within high yield, defined as bonds trading at spreads above 1,000 , has contracted sharply. Often viewed as a forward-looking default indicator, given that bonds trade to recovery value ahead of actual events, the decline in the distressed ratio is notable. The universe now stands $79 billion below its June 2022 peak and has fallen $41 billion, or 37%, from its April 2025 high. Cable and satellite issuers account for the largest share at 29%, followed by technology at 15% and healthcare at 10%.
— Ben McCubbin, Co-Head of High Yield, Global Fixed Income
HIGH YIELD DISTRESS RATIO
The distressed ratio contracted in May.
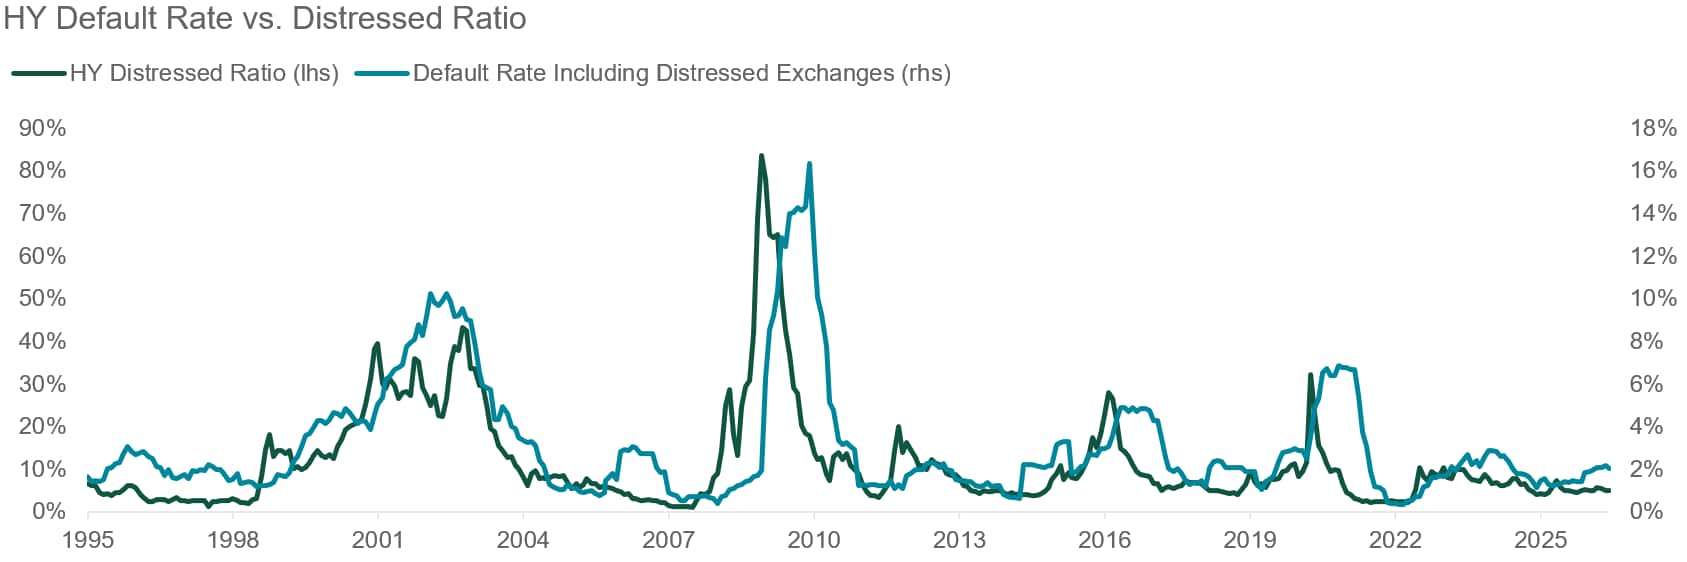
Source: Northern Trust Asset Management, JP Morgan. Historical trends are not predictive of future results. Data through May 2026.
- Risk assets continued to perform well in May, despite rising interest rates and continued conflict in Iran.
- The distressed bond universe is $79 billion below June 2022’s peak and -$41 billion (-37%) from its 2025 peak.
- Cable/Satellite accounts for 29% of distressed bonds, followed by Technology (15%) and Healthcare (10%).
Equities
Technology’s weight within global equities continues to rise, but the move has been far more pronounced in emerging markets (EM). Information Technology now exceeds 40% of the , driven by strength in semiconductor and hardware leaders. Taiwan Semiconductor Manufacturing represents roughly 13% of the index, with Samsung Electronics and SK Hynix near 7% each, underscoring the growing concentration of EM equity exposure in a small set of AI‑linked names.
This reflects a shift away from a narrow software-led cycle toward deeper integration across semiconductors, hardware, and digital infrastructure. The result is a widening gap versus developed markets, with EM becoming increasingly tech-heavy.
Earnings growth and AI-driven investment remain supportive, though leadership remains concentrated. With recent volatility helping to moderate excesses, we maintain a balanced and disciplined stance, keeping allocations steady while monitoring for broader participation and evolving macro risks.
— Jordan Dekhayser, Senior Equity Client Portfolio Manager & Daniel Kim, Associate Equity Client Portfolio Manager
EM BECOMING INCREASIGNLY TECH-HEAVY
EM tech concentration now exceeds global equities.
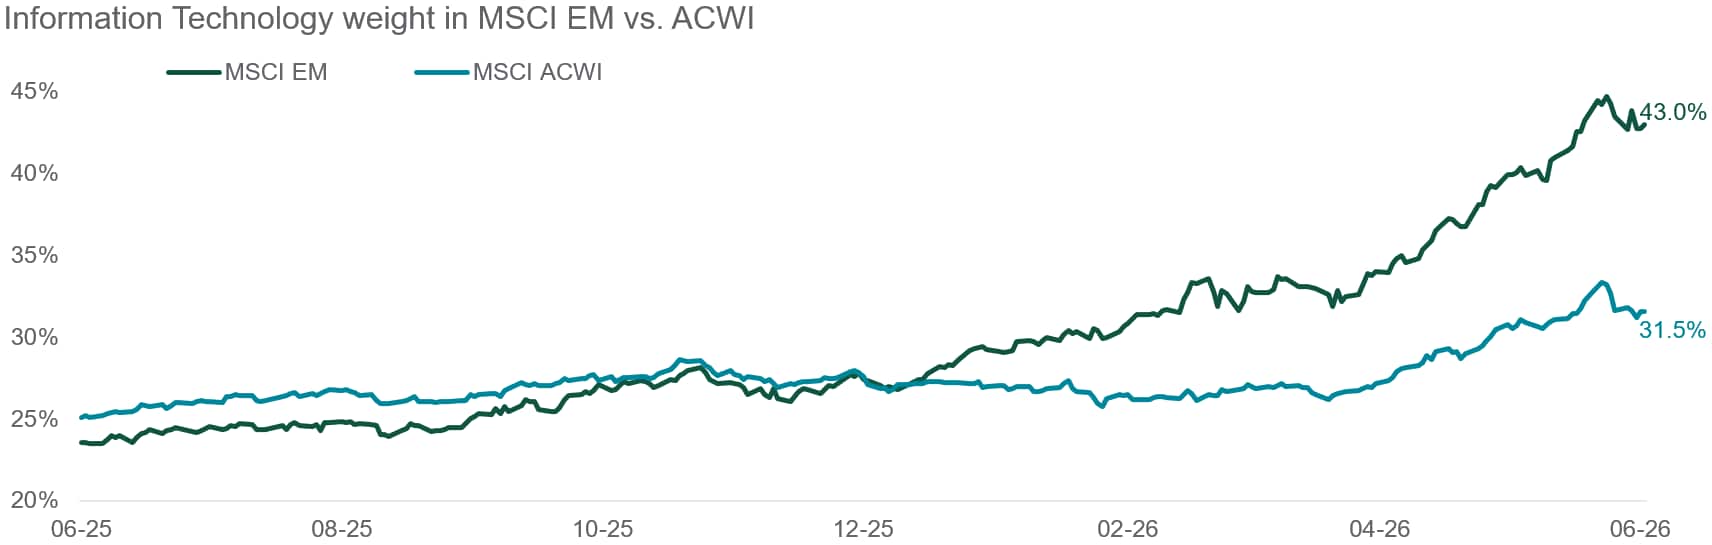
Source: Northern Trust Asset Management, FactSet. Data from 6/13/2025 through 6/11/2026. Historical trends are not predictive of future results.
- MSCI EM Information Technology’s weight has surged from ~23% to 43% over the past year, well above ACWI's 31.5%.
- This reflects the growing dominance of semiconductor and hardware leaders in EM.
- The gap underscores rising concentration risk, with EM structurally more tech-heavy than ACWI, even as AI-driven earnings and investments support the trend.
Real Assets
The shale revolution has significantly expanded U.S. energy supply, making the country one of the world’s most abundant and resilient energy producers. Yet electricity prices have risen meaningfully in recent years, highlighting a key imbalance: demand is outpacing the system’s ability to deliver power efficiently and reliably.
Rising prices often reflect infrastructure constraints rather than true scarcity. The grid has not kept pace with shifting demand patterns or geographical load shifts. Limitations in moving electricity are compounded by shortages of critical equipment, including turbines and transformers, as well as bottlenecks in natural gas pipelines and storage. These pressures stem from a structural shift in demand. After decades of flat consumption, the system was unprepared for rapid growth driven by the “electrification of everything.” Data center expansion, fueled by a more data-intensive economy and AI adoption, has added further strain.
The U.S. has ample energy resources, but without sustained investment in generation, transmission, and delivery systems, affordability and reliability will remain under pressure.
— Jim Hardman, Head of Real Assets, Multi-Manager Solutions
ABUNDANT ENERGY, CONSTRAINED DELIVERY
Rising electricity prices reflect infrastructure constraints
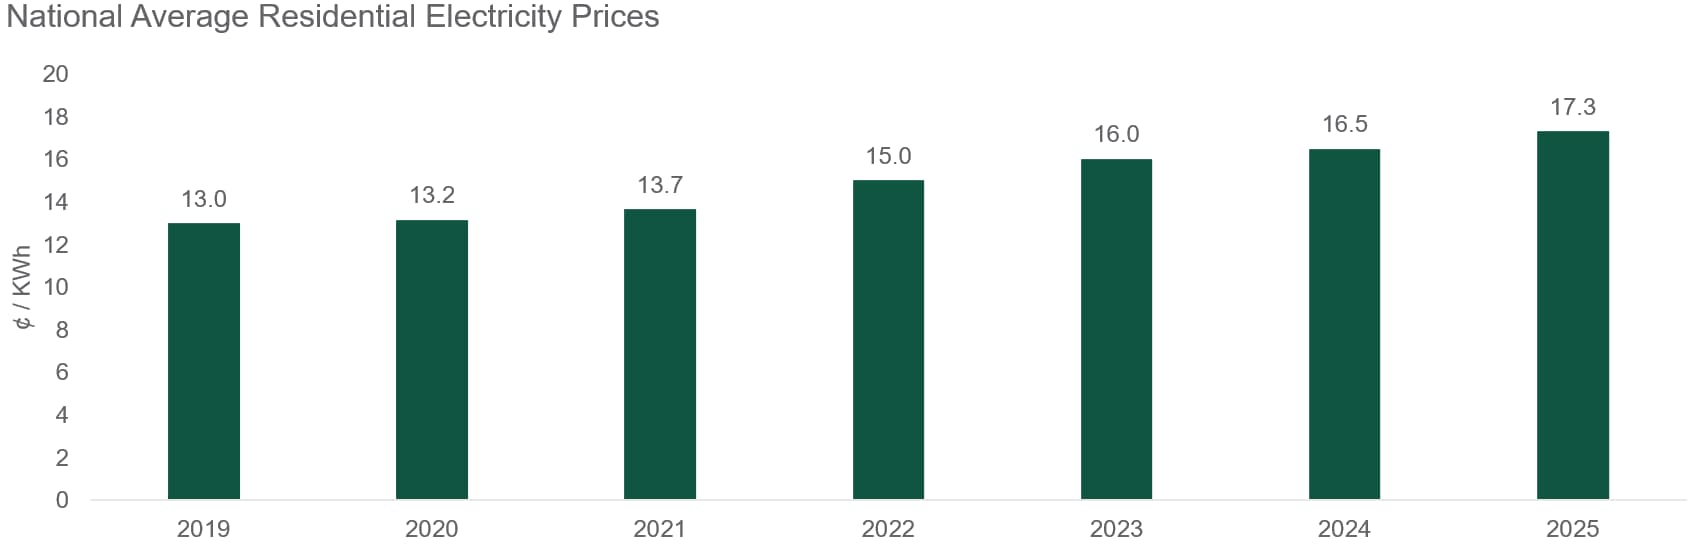
Source: Northern Trust Asset Management, Energy Information Administration (EIA). Data as of 12/31/2025. Historical trends are not predictive of future results.
- Electricity prices have risen as demand outpaces the system’s ability to deliver power.
- Rapid growth from electrification and data centers has exposed weakness in transmission and supply systems, leaving affordability and reliability under pressure.
- We affirm a tactical overweight to global listed infrastructure on compelling fundamentals and accelerating earnings due to rising demand.
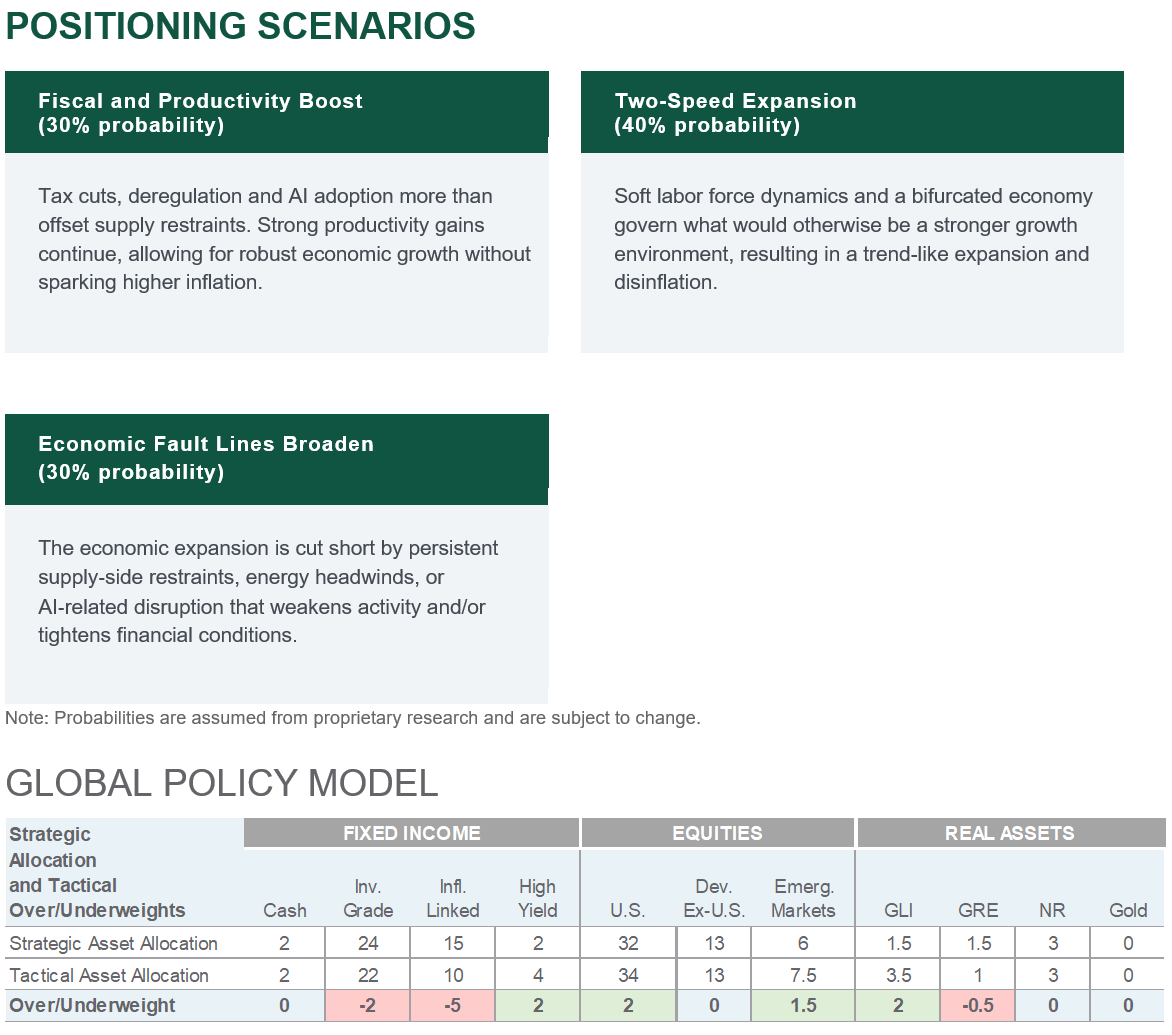
Source: Northern Trust Capital Market Assumptions Working Group, Investment Policy Committee. Strategic allocation is based on capital market return, risk and correlation assumptions developed annually; most recent model released 1/14/2026. The model cannot account for the impact that economic, market and other factors may have on the implementation and ongoing management of an actual investment strategy. Asset allocation does not guarantee a profit or protection against a loss in declining markets. GLI = Global Listed Infrastructure, GRE = Global Real Estate, NR = Natural Resources. Unless otherwise noted, the statements expressed herein are solely opinions of Northern Trust. Northern Trust does not make any representation, assurance, or other promise as to the accuracy, impact, or potential occurrence of any events or outcomes expressed in such opinions.
Unless noted otherwise, data in this piece is Sourced from Bloomberg as of June 2026.
Main Point
The Federal Reserve may soon have to decide: Is AI inflationary or deflationary?
The short-term AI build-out is straining supply and lifting costs—forcing the Fed to balance near-term inflation against future productivity gains.

Contact Us
Interested in learning more about our expertise and how we can help?
IMPORTANT INFORMATION
The information contained herein is intended for use with current or prospective clients of Northern Trust Investments, Inc (NTI) or its affiliates. The information is not intended for distribution or use by any person in any jurisdiction where such distribution would be contrary to local law or regulation. Northern Trust Asset Management’s (NTAM) and its affiliates may have positions in and may effect transactions in the markets, contracts and related investments different than described in this information. This information is obtained from sources believed to be reliable, its accuracy and completeness are not guaranteed, and is subject to change. Information does not constitute a recommendation of any investment strategy, is not intended as investment advice and does not take into account all the circumstances of each investor.
This information is provided for informational purposes only and is not intended to be, and should not be construed as, an offer, solicitation or recommendation with respect to any transaction and should not be treated as legal advice, investment advice or tax advice. Recipients should not rely upon this information as a substitute for obtaining specific legal or tax advice from their own professional legal or tax advisors. References to specific securities and their issuers are for illustrative purposes only and are not intended and should not be interpreted as recommendations to purchase or sell such securities. Indices and trademarks are the property of their respective owners. Information is subject to change based on market or other conditions.
All securities investing and trading activities risk the loss of capital. Each portfolio is subject to substantial risks including market risks, strategy risks, advisor risk, and risks with respect to its investment in other structures. There can be no assurance that any portfolio investment objectives will be achieved, or that any investment will achieve profits or avoid incurring substantial losses. No investment strategy or risk management technique can guarantee returns or eliminate risk in any market environment. Risk controls and models do not promise any level of performance or guarantee against loss of principal. Any discussion of risk management is intended to describe NTAM’s efforts to monitor and manage risk but does not imply low risk.
Past performance is not a guarantee of future results. Performance returns and the principal value of an investment will fluctuate. Performance returns contained herein are subject to revision by NTAM. Comparative indices shown are provided as an indication of the performance of a particular segment of the capital markets and/or alternative strategies in general. Index performance returns do not reflect any management fees, transaction costs or expenses. It is not possible to invest directly in any index. Net performance returns are reduced by investment management fees and other expenses relating to the management of the account. Gross performance returns contained herein include reinvestment of dividends and other earnings, transaction costs, and all fees and expenses other than investment management fees, unless indicated otherwise. For U.S. NTI prospects or clients, please refer to Part 2a of the Form ADV or consult an NTI representative for additional information on fees.
Forward-looking statements and assumptions are NTAM’s current estimates or expectations of future events or future results based upon proprietary research and should not be construed as an estimate or promise of results that a portfolio may achieve. Actual results could differ materially from the results indicated by this information. Historical trends are not predictive of future results.
Northern Trust Asset Management is composed of Northern Trust Investments, Inc., Northern Trust Global Investments Limited, Northern Trust Fund Managers (Ireland) Limited, Northern Trust Global Investments Japan, K.K., NT Global Advisors, Inc., 50 South Capital Advisors, LLC, Northern Trust Asset Management Australia Pty Ltd, and investment personnel of The Northern Trust Company of Hong Kong Limited and The Northern Trust Company.
Not FDIC insured | May lose value | No bank guarantee