- Who We Serve
- What We Do
- About Us
- Insights & Research
- Who We Serve
- What We Do
- About Us
- Insights & Research
TIPS in Focus: Inflation Protection with Portfolio Precision
A practical look at how TIPS work, what breakevens are signaling and how investors can position inflation-linked exposure within fixed income portfolios.
Key Points
TIPS provide direct inflation protection by linking principal to CPI, with relative value driven by breakeven inflation.
They perform best when inflation surprises higher, with shorter maturities more responsive to changes in inflation expectations and longer maturities more rate-sensitive.
Effective use requires intentional portfolio construction, aligning maturity, duration, and allocation with inflation expectations.
You don’t have to go farther than your local grocery store to see how inflation has shaped everyday expenses in recent years. While inflation has moderated from its peak, bringing it sustainably back toward the Federal Reserve’s target has proven more challenging than initially expected and remains a central focus of the Federal Open Market Committee.
Recent geopolitical developments, including the war involving Iran, have disrupted key supply routes, adding inflationary pressures. This environment has renewed investor interest in Treasury Inflation-Protected Securities (TIPS). In this paper, we address several of the most common questions we continue to receive about these fixed-income securities.
What are TIPS and how is inflation priced in?
TIPS are Treasurys in which the principal amount increases with inflation and decreases with deflation1. They capture a fixed real interest rate while accruing actual changes in the Consumer Price Index (CPI)2, subject to an approximate three-month lag. The inflation rate priced into the market reflects the difference between a similar-maturity fixed-rate Treasury bond (a “nominal Treasury”3) vs. TIPS. The difference in yield — the breakeven rate — is primarily the inflation expectation priced into the market along with smaller variables including a risk premium, liquidity differences, fluctuations in value from a deflation floor embedded in TIPS, and differences in tax treatments.
If inflation, measured by CPI, comes in above the breakeven rate over the life of the bond, an investor earns more relative to similar-maturity nominal Treasurys. The opposite is true if inflation comes in below the breakeven rate.4 If inflation comes in at the breakeven rate, the investor makes the same in either a similar-maturity nominal Treasury or TIPS — hence the term “breakeven rate.” The difference between TIPS and similar maturity nominal Treasurys can help provide guidance on where the market expects inflation to be.
Does the market usually get inflation right?
Throughout their history, the TIPS breakeven rate has served as a reliable predictor of inflation when inflation was relatively stable and close to the Fed’s 2% target. In early days, TIPS generally underperformed since they effectively paid a risk premium relative to nominal Treasurys in exchange for their additional inflation protection. In recent years, however, when inflation moved notably above the Fed’s target, TIPS served their intended purpose and outperformed similar maturity nominal Treasurys.
The chart below shows the beginning five-year breakeven rate over time in gray, and the actual average annual inflation experienced over the subsequent five years in green. When the green line was below the gray lines, investors earned more over that historical five year period by buying a five-year nominal Treasury vs. a five-year TIPS. When the green line was above the gray lines, investors earned more with five-year TIPS than a five-year nominal Treasury. (The green line stops five years back as the full period has not yet transpired.) Over the last 10 years, investors were better off buying a five-year TIPS vs. five-year nominal Treasurys given inflation has persistently come in over market expectations.
How is the TIPS market currently pricing for inflation?
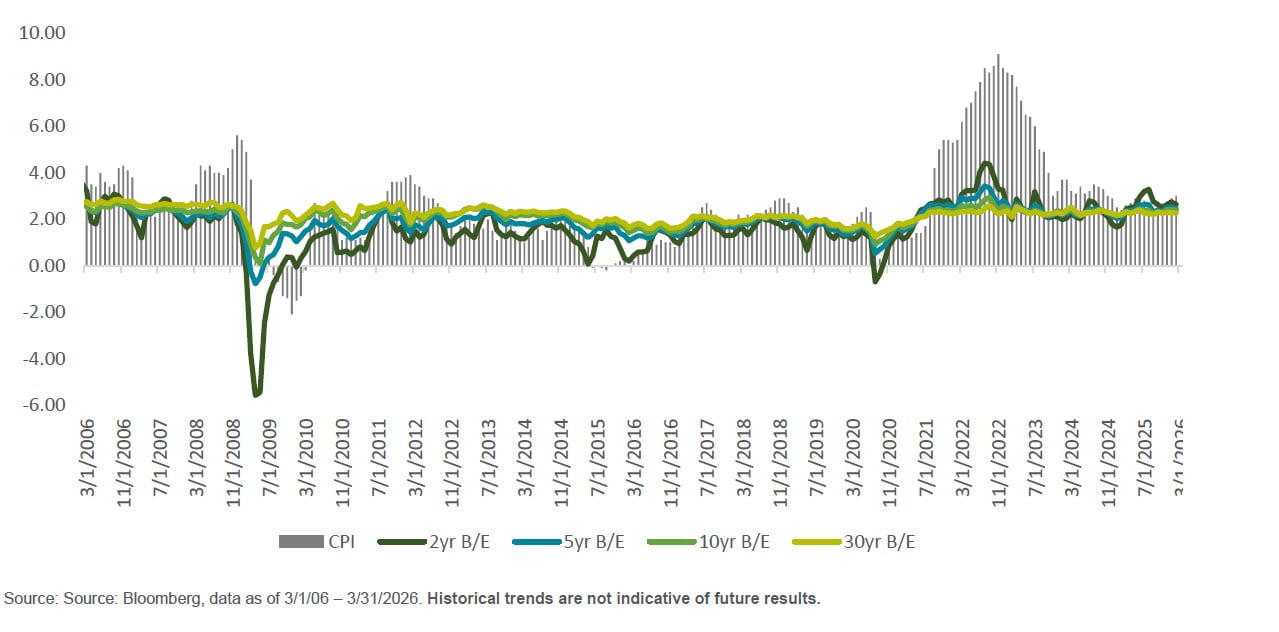
Breakevens have remained close to the Fed’s 2% target through the recent inflationary period. Today we see breakevens at approximately 2.5% for the next five years and 2.4%5 for the next 10 years, even as inflation remains above 3%6 for the CPI and Personal Consumption Expenditures (PCE), a measure of consumer spending on goods and services among households in the U.S.
The latter is the Fed’s preferred inflation measure. Meanwhile, TIPS holders capturing the currently higher inflation accruals may also potentially benefit should inflation prove to be stickier than anticipated.
On the other hand, if inflation falls below the breakeven of 2.4%, or if deflation takes hold, TIPS will likely still benefit in price performance as real rates are likely to decline in sympathy. However, similar maturity nominal Treasurys would likely do even better. The below chart shows breakeven rates for different tenors over time relative to the annual inflation rate as measured by CPI.
Exhibit 2: Breakevens Over Time
Do TIPS have a structural place in portfolio construction even though they are not represented in most fixed income indices?
Many of our liabilities are inflation based, and while multiple sectors that capture a market risk premium can help to buffer a portfolio over time — e.g. equities, high yield bonds — TIPS are one of few asset classes anticipated to perform well in a defensive environment with a direct link to inflation.
This can be especially important in an unanticipated environment, such as a supply shock where the inflationary pulse will immediately pass through to TIPS holders through inflation accruals — as we recently saw — or periods of stagflation in which inflation remains persistently higher than expected while growth softens or turns negative.
How do TIPS behave with the rest of a fixed income portfolio?
This has been a primary source of confusion since TIPS were introduced in 1997, because the price sensitivity to interest rates or duration of TIPS is different than that of similar-maturity nominal bonds. TIPS yields are a function of real rates7 while nominal yields are a function of real rates plus the breakeven rate.
We typically compare bonds to one another by how their yields move up and down together. To understand how nominal bonds and TIPS react to market movements, one must understand the drivers of yield for each type of bond. Over any holding period the relationship between the return on the two types of bonds depends on the combination of real rate and breakeven rate movements. While nominal bond yields are easily explained by general interest rate moves, and TIPS yields by moves in real rates, the relationship of real rates and nominal rates are not always stable. Consider these scenarios:
- Interest rate changes are dominated by changes in real rates; breakeven rates remain unchanged.
TIPS and nominal bonds with similar maturities respond similarly to changes in interest rates.
- Interest rate changes are dominated by changes in inflation expectations; real rates do not change, but breakeven rates do.
TIPS prices do not change while nominal bond prices do.
- Interest rate changes are due to changes in both real rates and breakeven rates in the same direction.
Similar maturity nominal bond prices move more than TIPS prices.
- Interest rate changes are due to changes in real rates and breakeven rates moving in different directions.
TIPS prices experience a greater move than nominal bonds.
Different scenarios can cause the duration contribution of TIPS to fluctuate throughout the total portfolio’s duration. The below chart shows the duration8 of iBoxx 3-Year and 5-Year Target Duration TIPS indices relative to the Bloomberg U.S. TIPS Indices in 0-5 year, 1-10 year, and full index breakouts9 as represented by the index providers.
While there is no agreed upon adjustment to duration that compares apples to apples, since methodologies are based on historical relationships between changes in real rates and inflation expectations or different forward-looking assumptions (as in scenarios 1-4), the impact on a portfolio can be quite material to total portfolio duration. This is why we believe a targeted approach to duration management can add precision to TIPS inclusion within a traditional fixed-income portfolio.
What maturity should I select for a TIPS allocation?
Like any fixed rate bond portfolio, the tenor can have a significant impact on TIPS holders’ experience. TIPS have a fixed real rate, and the principal is adjusted up or down for inflation/deflation. The coupon payments are then applied to the inflation adjusted principal amount.
Because the market tends to price inflation as reverting to the Fed’s target over the course of a one- to two-year period, TIPS with a longer maturity have more price sensitivity to the fixed real rate and relatively little sensitivity to near-term changes in inflation. Likewise, TIPS with shorter maturities have less price sensitivity to real rates resulting in a greater proportion of performance coming from inflation.
The chart below shows the breakout of real rates and breakeven rates on 6/1/26 for a 10-year TIPS with a 4.45% yield.
While all TIPS capture the same inflation accruals, the journey can feel very different depending on the tenor of the bonds. The chart below shows how TIPS with shorter maturities are more correlated with inflation, while TIPS with longer maturities are more correlated with changes in interest rates.
Short-term price performance is not the only factor to consider. If the objective of an investor’s TIPS allocation is to immunize the amount invested in TIPS from inflation over time, a full-maturity TIPS portfolio may be more appropriate. If the objective is to improve the portfolios responsiveness to surprise inflation, then a shorter maturity TIPS allocation may make more sense.
When breaking out TIPS performance across different maturity slices and comparing the performance of each maturity slice in different regimes, historically in a resurging inflation environment — especially impacted by unanticipated supply disruptions — shorter TIPS had the most positive performance as inflation passed through. Longer-term TIPS were negatively impacted by the higher interest rate sensitivity dominating performance as rates rose, which is frequently a response to higher inflation.
Other regimes including Stable Growth with predictable inflation (09/2002 – 08/2007), the period of the global financial crisis (09/2007-03/2009), and the period after where inflation and growth were lower, and monetary policy was loose (04/2009-12/2020), all resulted in longer TIPS outperforming as interest rates — including real rates rallied.
While not addressed on this paper, it is still important, to understand how a TIPS allocation will interact with the rest of a fixed-income portfolio. For example, the decision of duration and maturity alignment should be made at the full portfolio level, while the inclusion of TIPS relative to nominal bonds is a function of inflation orientation and breakeven rates.
TIPS: Inflation protection with portfolio precision
In conclusion, the market hasn’t always gotten inflation right, especially when inflation has moved away from the Federal Reserve’s target. Today, as in most of TIPS history, inflation expectations priced into TIPS anticipate a successful return to the Fed’s 2% target. While some investment sectors capture a risk premium that can buffer a portfolio over time (e.g. equities or high-yield bonds), TIPS are one of few asset classes that can perform well in a defensive environment with a direct link to inflation.
With that said, there remains a need for intentionality when considering integrating TIPS as part of a broader fixed income portfolio. Understanding how the relationship between TIPS and other nominal bonds shifts over time as well as the maturity range that meets the intended portfolio objectives can make a substantial difference.
- There is a deflation floor embedded in TIPS so that in the event of deflation over the term of the bond, TIPS return at maturity their original par value at the minimum.
- The CPI referenced in TIPS is the Consumer Price Index for All Urban Consumers calculated by the Bureau of Labor and Statistics and not seasonally adjusted.
- A “nominal Treasury” refers to a conventional Treasury security whose coupon and principal payments are fixed in dollar terms and are not adjusted for inflation.
- TIPS and similar nominal Treasurys can have different risk profiles, this statement does not consider the compensation on a risk adjusted basis.
- As of 6/1/26.
- CPI for May 2026 came in at 4.2% year over year. PCE for April 2026 was 3.8% year-over-year. Consumer Price Index (CPI) measures the change in the price of goods and services from the perspective of the consumer. While the TIPS reference inflation index is CPI, the Fed’s preferred measure of inflation is PCE. Personal Consumption Expenditures Price Index (PCE) is the measure of the prices that people living in the United States, or those buying on their behalf, pay for goods and services.
- Real Rate for Treasury Inflation-Protected Securities (TIPS) is the actual return on an investment after adjusting for inflation.
- Duration is a measure of the sensitivity of the price of a bond or other debt instrument to a change in a bond’s own yield (nominal yields have an additional driver vs TIPS). A bond’s duration is easily confused with its term or time to maturity because certain types of duration measurements are also calculated in years. Duration is one the key determinants of fixed income price changes. Swings in interest rates expose portfolios to interest rate risk.
- Effective nominal duration. Methodology is differentiated to each index provider.
Related Content



Contact Us
Interested in learning more about our expertise and how we can help?
The Bloomberg U.S. TIPS Index measures U.S. Treasury Inflation Protected Securities.
The Bloomberg U.S. Treasury TIPS 0 – 5 Years Total Return Index Value Unhedged USD is composed of TIPS with remaining maturities of less than five years.
The Bloomberg 1 – 10 Year U.S. Government Inflation-Linked Bond Index is designed to measure the performance of the inflation protected public obligations of the U.S.
The Bloomberg U.S. Treasury 5 – 10 Year Index measures the performance of public obligations of the U.S. Treasury with maturities of 5 – 10 years, including securities roll up to the U.S. Aggregate, U.S. Universal, and Global Aggregate Indices.
The Bloomberg TIPS 5 – 10 Year Index Adjusted Total Return Index measures U.S. Treasury Inflation Protected Securities with less than 10 years maturity.
The iBoxx 3-Year Target Duration TIPS Index measures the performance of Treasury Inflation Protected Securities (TIPS) as determined by Markit iBoxx’s proprietary index methodology. The iBoxx index methodology targets a modified adjusted duration of 3.0 years and defines the eligible universe of TIPS as having no less than one year and no more than ten years until maturity as of the Index determination date. A proprietary regression calculation is then used to determine the modified adjusted duration of the TIPS and weight the TIPS in the Index at a modified adjusted duration level within a range of 5.0 years, plus or minus 5% within Index constraints. One cannot invest directly in an index.
The iBoxx 5-Year Target Duration TIPS Index measures the performance of Treasury Inflation Protected Securities (TIPS) as determined by Markit iBoxx’s proprietary index methodology. The iBoxx index methodology targets a modified adjusted duration of 5.0 years and defines the eligible universe of TIPS as having no less than one year and no more than ten years until maturity as of the Index determination date. A proprietary regression calculation is then used to determine the modified adjusted duration of the TIPS and weight the TIPS in the Index at a modified adjusted duration level within a range of 5.0 years, plus or minus 5% within Index constraints. One cannot invest directly in an index.
USGGBE02 Index represents the U.S. TIPS Breakeven 2-year rate.
USGGBE05 Index represents the U.S. TIPS Breakeven 5-year rate.
USGGBE10 Index represents the U.S. TIPS Breakeven 10-year rate.
USGGBE30 Index represents the U.S. TIPS Breakeven 30-year rate.
IMPORTANT INFORMATION
For Canada, Asia-Pacific (APAC) and Europe, Middle East and Africa (EMEA) markets, this information is directed to institutional, professional and wholesale clients or investors only and should not be relied upon by retail clients or investors. This information may not be edited, altered, revised, paraphrased, or otherwise modified without the prior written permission of NTAM. The information is not intended for distribution or use by any person in any jurisdiction where such distribution would be contrary to local law or regulation. NTAM may have positions in and may effect transactions in the markets, contracts and related investments different than described in this information. This information is obtained from sources believed to be reliable, its accuracy and completeness are not guaranteed, and is subject to change. Information does not constitute a recommendation of any investment strategy, is not intended as investment advice and does not take into account all the circumstances of each investor.
This information is provided for informational purposes only and is not intended to be, and should not be construed as, an offer, solicitation or recommendation with respect to any transaction and should not be treated as legal advice, investment advice or tax advice. Recipients should not rely upon this information as a substitute for obtaining specific legal or tax advice from their own professional legal or tax advisors. References to specific securities and their issuers are for illustrative purposes only and are not intended and should not be interpreted as recommendations to purchase or sell such securities. Indices and trademarks are the property of their respective owners. Information is subject to change based on market or other conditions.
All securities investing and trading activities risk the loss of capital. Each portfolio is subject to substantial risks including market risks, strategy risks, advisor risk, and risks with respect to its investment in other structures. There can be no assurance that any portfolio investment objectives will be achieved, or that any investment will achieve profits or avoid incurring substantial losses. No investment strategy or risk management technique can guarantee returns or eliminate risk in any market environment. Risk controls and models do not promise any level of performance or guarantee against loss of principal. Any discussion of risk management is intended to describe NTAM’s efforts to monitor and manage risk but does not imply low risk.
Past performance is not a guarantee of future results. Performance returns and the principal value of an investment will fluctuate. Performance returns contained herein are subject to revision by NTAM. Comparative indices shown are provided as an indication of the performance of a particular segment of the capital markets and/or alternative strategies in general. Index performance returns do not reflect any management fees, transaction costs or expenses. It is not possible to invest directly in any index. Net performance returns are reduced by investment management fees and other expenses relating to the management of the account. Gross performance returns contained herein include reinvestment of dividends and other earnings, transaction costs, and all fees and expenses other than investment management fees, unless indicated otherwise. For U.S. NTI prospects or clients, please refer to Part 2a of the Form ADV or consult an NTI representative for additional information on fees.
Forward-looking statements and assumptions are NTAM’s current estimates or expectations of future events or future results based upon proprietary research and should not be construed as an estimate or promise of results that a portfolio may achieve. Actual results could differ materially from the results indicated by this information. Historical trends are not predictive of future results.
This information is intended for purposes of NTI and/or its affiliates marketing as providers of the products and services described herein and not to provide any fiduciary investment advice within the meaning of Section 3(21) of the Employee Retirement Income Security Act of 1974, as amended (ERISA). NTI and/or its affiliates are not undertaking to provide a recommendation or give investment advice in a fiduciary capacity to the recipient of these materials, which are for marketing purposes and are not intended to serve as a primary basis for investment decisions. NTI and/or its affiliates may receive fees and other compensation in connection with the products and services described herein as well as for custody, fund administration, transfer agent, investment operations outsourcing, and other services rendered to various proprietary and third-party investment products and firms that may be the subject of or become associated with the services described herein.
Northern Trust Asset Management is composed of Northern Trust Investments, Inc., Northern Trust Global Investments Limited, Northern Trust Fund Managers (Ireland) Limited, Northern Trust Global Investments Japan, K.K., NT Global Advisors, Inc., 50 South Capital Advisors, LLC, Northern Trust Asset Management Australia Pty Ltd, and investment personnel of The Northern Trust Company, The Northern Trust Company (Singapore Branch), and The Northern Trust Company of Hong Kong Limited.
Not FDIC insured | May lose value | No bank guarantee