- Who We Serve
- What We Do
- About Us
- Insights & Research
- Who We Serve
- What We Do
- About Us
- Insights & Research
Save to bookmark
Investment Perspective · 01.30.24
Policy and Politics
Investors may need to adopt a more cautious investment stance, diversifying across asset classes and closely monitoring central banks policies and geopolitical developments while being flexible to adjust strategies due to evolving market conditions.
- Portfolio Construction
- Multi-Asset Insights
- Equity Insights
- Fixed Income Insights
Policy and Politics
Save to bookmark
Save to bookmark
Key Points
What it is
We expect a U.S. soft landing, areas of global economic weakness, and hesitant central banks.
Why it matters
Awareness of interest rate fluctuations and geopolitical risks is essential to navigating potential market volatilities.
Where it's going
We forecast a cautious investment approach with a focus on high yield bonds, given the potential for a U.S. soft landing and global economic concerns.
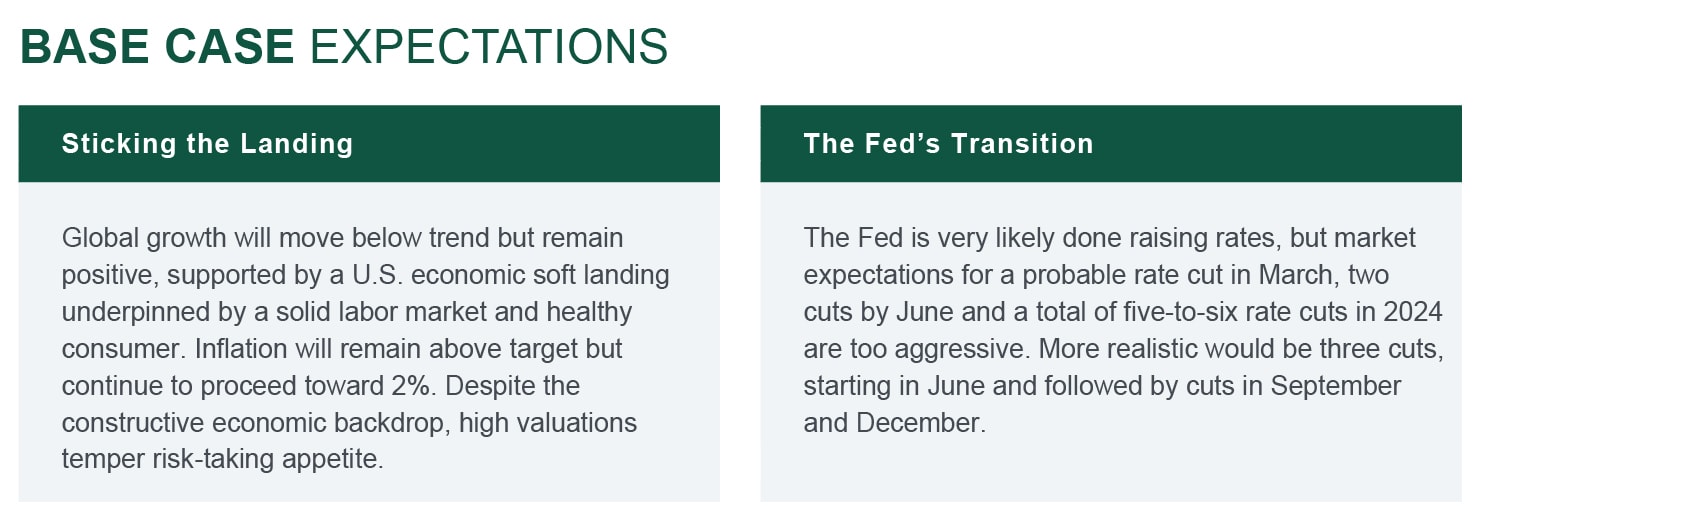
Focus remains on monetary policy with investors parsing Fed minutes and statements. Rate cut hopes drove much of the Santa Claus rally, but the Fed has not committed to investors’ full wish list. Politics will battle monetary policy for mindshare; ~40% of the planet can cast a vote this year, including the U.S. and Taiwan (which just reelected its nationalist party). We expect a U.S. soft landing, areas of global economic weakness and hesitant central banks. When joined by elevated U.S. equity valuations and geopolitical risks, the macro backdrop endorses a small underweight to risk and a preference for high yield over equities.
Interest rates will likely show less volatility this year
The 10-year U.S. Treasury (UST) yield ended 2023 at 3.88% — the same level as it ended 2022, but with a rise to a high of 4.99% along the way. Given our call for a U.S. soft landing and modest Fed accommodation, it's reasonable to expect the 10-year UST yield to end 2024 around 4% again, and without last year’s detour higher. We side with the Fed’s forecast calling for three 0.25% rate cuts this year (versus market calls for roughly six) with the first cut occurring at the June Fed meeting (versus market expectations for March). Such an outcome would likely remove the inversion from most of the yield curve by bringing down the front end more than the back end — presenting a reasonable backdrop for risk-control assets.
Comparing Powell’s soft landing to Greenspan’s
The last time the Fed achieved a soft landing — in 1995 — the S&P 500 gained 38%, kicking off the dotcom era and a five-year period of 29% annualized returns. Could AI elicit a similar market reaction as the internet revolution? Perhaps. But starting-point equity valuations today are much higher — 24.9 on a price-to-trailing-earnings (P/E) basis (versus 16.9 heading into 1995, ultimately reaching 30.7 at the end of the five-year period). Today’s 4.0% S&P 500 earnings yield compares unfavorably to the 7.6% yield on — especially given the ~1.5% real growth environment we expect (versus the 4.2% annual growth from ‘95-‘99). Also, profit margins will be pressured as companies roll over debt at rates around double what was secured post-pandemic (~8% from ~4% in high yield and ~5% from ~2% in investment grade).
Getting paid upfront in a risky, modest-growth world
We like high yield’s income generation over the potential price appreciation in developed market equities, wherein U.S. valuations are rich and European growth is at risk. Emerging market equities are looking more attractive but we seek more clarity on the contours of Fed policy and the implications of Taiwan’s election before going overweight. We are strategically allocated across all real assets.
Exhibit 1: RATE CUT RECONCILIATION NEEDED
Markets are hoping for a March start to rate cuts and a total of roughly six in 2024; the Fed is only offering three so far.
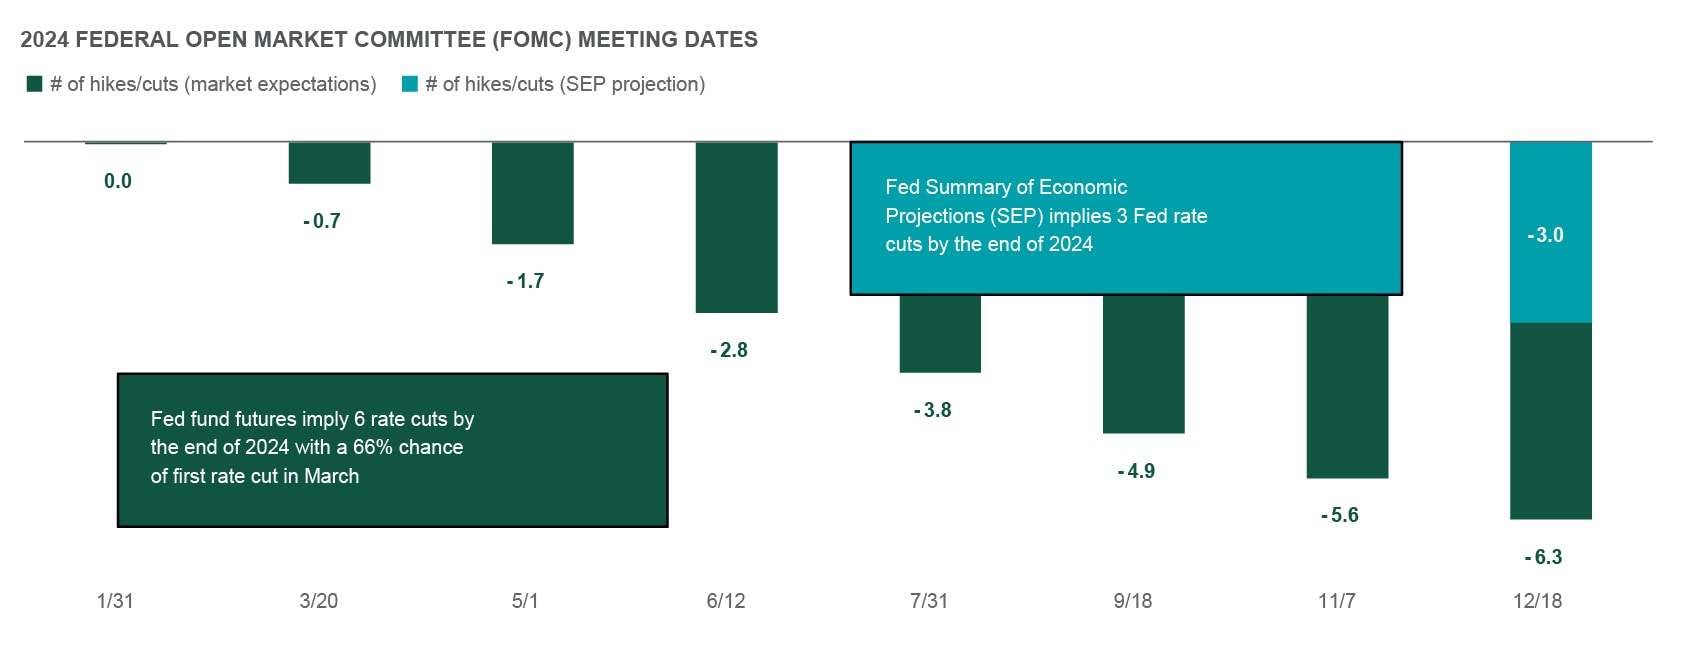
Source: Northern Trust Asset Management, Bloomberg. Summary of Economic Projections (SEP) as of 12/13/2023. Market expectations implied by futures. Data as of 1/16/2024.
Interest Rates
Last month we wrote about the reduced usage of the , anticipating more volatility in repo rates. Given recent comments from the Fed on the facility, it’s worth revisiting why the decline matters for the broader interest rate markets. As RRP participation has declined, and competition from private sector repo market participants has increased, we’ve seen a corresponding increase in funding rate volatility as measured by SOFR (Secured Overnight Financing Rate — an average of daily repo transaction rates). SOFR recently surged to 5.4% on January 2nd. The last time we saw this level of SOFR volatility was in 2018 and 2019, which was also the last time the Fed was shrinking the size of its balance sheet — also known as quantitative tightening (QT).
SOFR spiked by nearly 3% in September 2019. In response, the Fed — realizing it had drained too much liquidity from the system — brought that round of QT to a quick halt. The most recent Fed meeting minutes revealed this topic is again top of mind — and subsequent comments from former and current Fed officials are keeping investors on alert for any upcoming QT changes. Right now, liquidity remains sufficient with ample bank reserves in aggregate — so QT tapering is not imminent, but we will be monitoring.
Federal Reserve Reverse Repo Facility
In a Federal Reserve reverse repo transaction, the Fed sells securities to a counterparty subject to an agreement to repurchase the securities for a higher price at a later date. The Fed's Reverse Repo Facility helps acts as an alternative investment for money market investors when rates fall.
EXHIBIT 2: QT SIgnals
Declining RRP usage may signal a need for QT tapering.
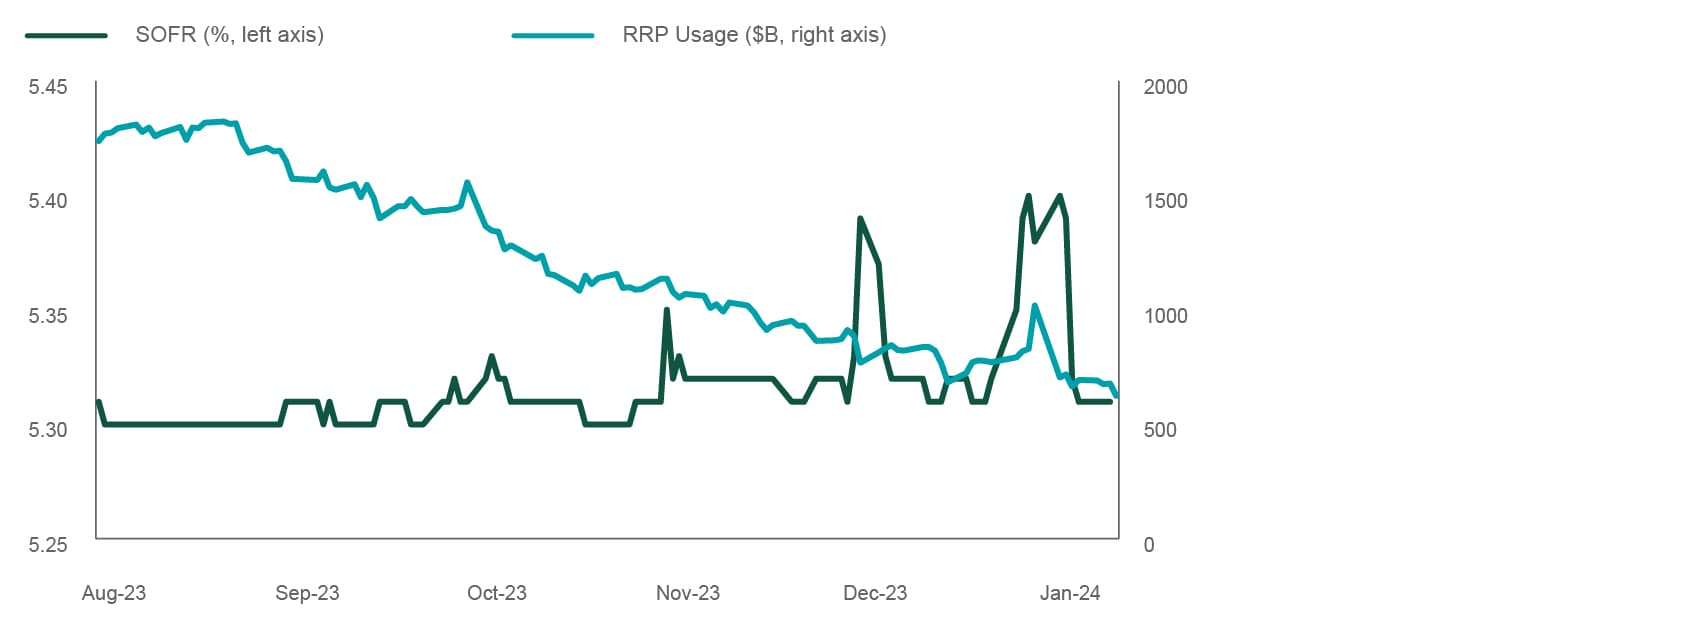
Source: Northern Trust Asset Management, Bloomberg. RRP = Fed Reverse Repo Facility. SOFR = Secured Overnight Financing Rate. Data from 8/1/2023 through 1/11/2024. Historical trends are not predictive of future results.
- Fed minutes stated “several” officials were interested in initial discussions on slowing the pace of QT. Ensuing Fed comments pointed to declining RRP usage.
- We view QT as a tool used by the Fed to manage policy within the bounds set forth by its policy rate. Talk of QT tapering should not be confused with rate cuts.
- We agree that monetary policy easing is in sight, but market pricing for rate cuts is likely too aggressive.
Credit Markets
The high yield market saw continued strong performance after Fed Chair Powell signaled that the central bank is increasingly focused on the timeline for cutting rates at its December meeting. High yield fundamentals haven taken a hit as a result of the unprecedented hiking cycle and resulting increase in the cost of capital. However, coverage ratios suggest manageable impacts. Amid stronger-than-expected economic growth and resilient consumer spending, earnings before interest, tax, depreciation and amortization (EBITDA) for high yield issuers improved in the third quarter. Per the chart on the right, this helped lead to a slight improvement in leverage and interest coverage ratios. The earnings improvement drove the net leverage improvement, though reduced debt also helped.
A less hawkish Fed and improving fundamentals should continue to support high yield valuations. Also, a benign default outlook provides an attractive backdrop for a historically elevated level of carry and total return potential. Lastly, Treasury yields have become a larger component of the overall yield for high yield, providing a nice cushion to alleviate lower returns if economic uncertainty were to lead to lower interest rates.
EXHIBIT 3: A FUNDAMENTAL CHECK
High yield coverage ratios are in good shape.
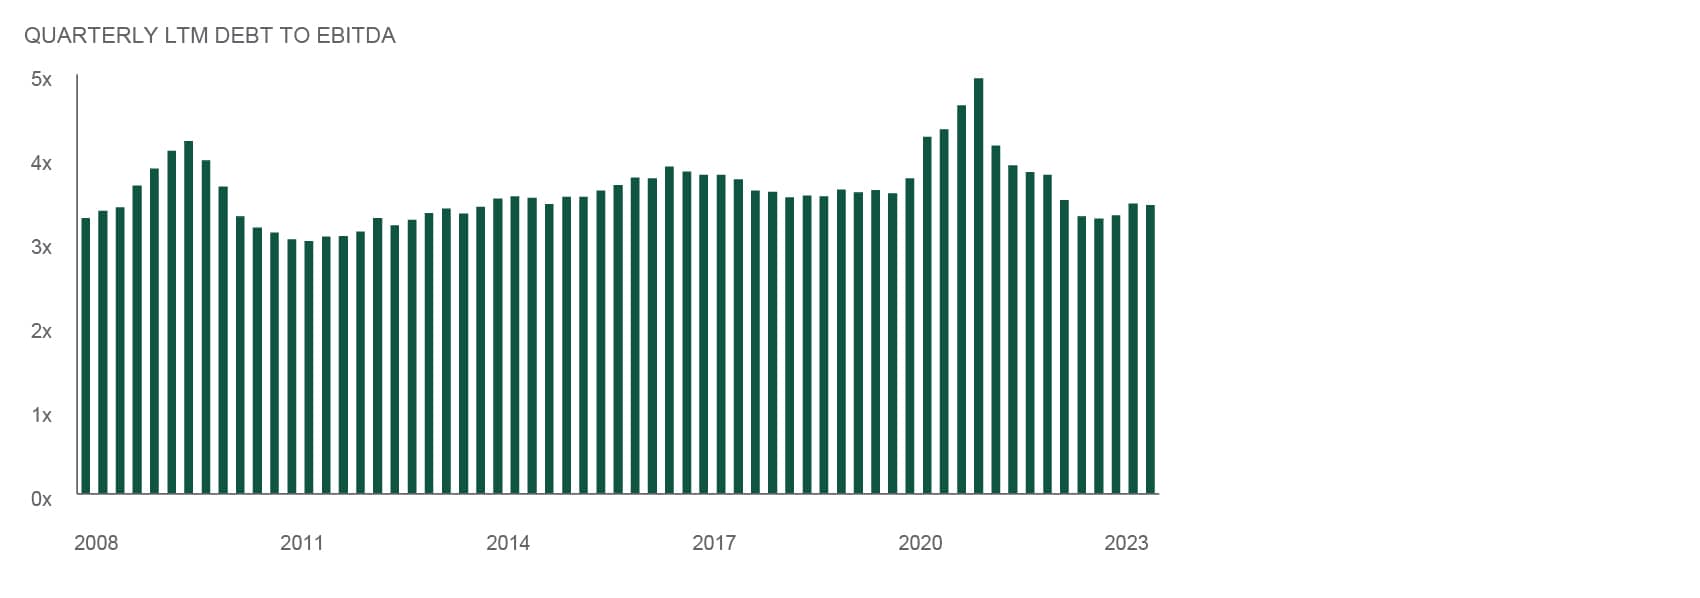
Source. Northern Trust Asset Management, JP Morgan. LTM = last twelve months. EBITDA = earnings before interest, taxes, depreciation and amortization. Quarterly data from 1/1/2008 through 9/30/2023.
- The debt to earnings ratio for high yield issuers improved in the most recent quarter.
- High yield fundamentals are in decent shape overall — a compelling feature given elevated all-in yields.
- High yield remains our highest conviction tactical overweight in the Global Policy Model.
Equities
Global equities gained 5.3% in December, with developed equities leading the way. Emerging market equities (EM) lagged but still delivered strong returns. The rally occurred alongside a 45-bp decline in the 10-year Treasury yield. Cyclicals handily outperformed defensives, and small caps recorded an even more sizable return over large caps. Across the full-year 2023, U.S. market leadership was narrow. The Magnificent Seven contributed to about 60% of the S&P 500’s return. However, those gains meaningfully broadened during the late-2023 rally.
Markets got off to a dull start the first week of this year and many of the late-2023 leaders were laggards. Sentiment indicators were stretched, and after a +16% gain for U.S. equities off of late October lows the market was poised for a breather. Moving forward, we maintain a constructive economic outlook with a U.S. soft landing our base case. Our enthusiasm is tempered by aggressive market pricing for rate cuts and historically elevated U.S. valuations. However, in recognition of abating recession risks and coming into sight, we increased our EM allocation to equal-weight from 1% underweight. EM valuations are not stretched and 2024 earnings growth is expected to be the strongest of the regions (see chart).
Monetary easing
Monetary easing is a policy tool used by central banks to encourage economic growth and increase money supply. The goal of most monetary easing is to encourage borrowing and spending by businesses and consumers, which can boost economic activity and counteract deflationary pressures.
EXHIBIT 4: EARNINGS REBOUND
2024 is expected to be a year of solid earnings growth.
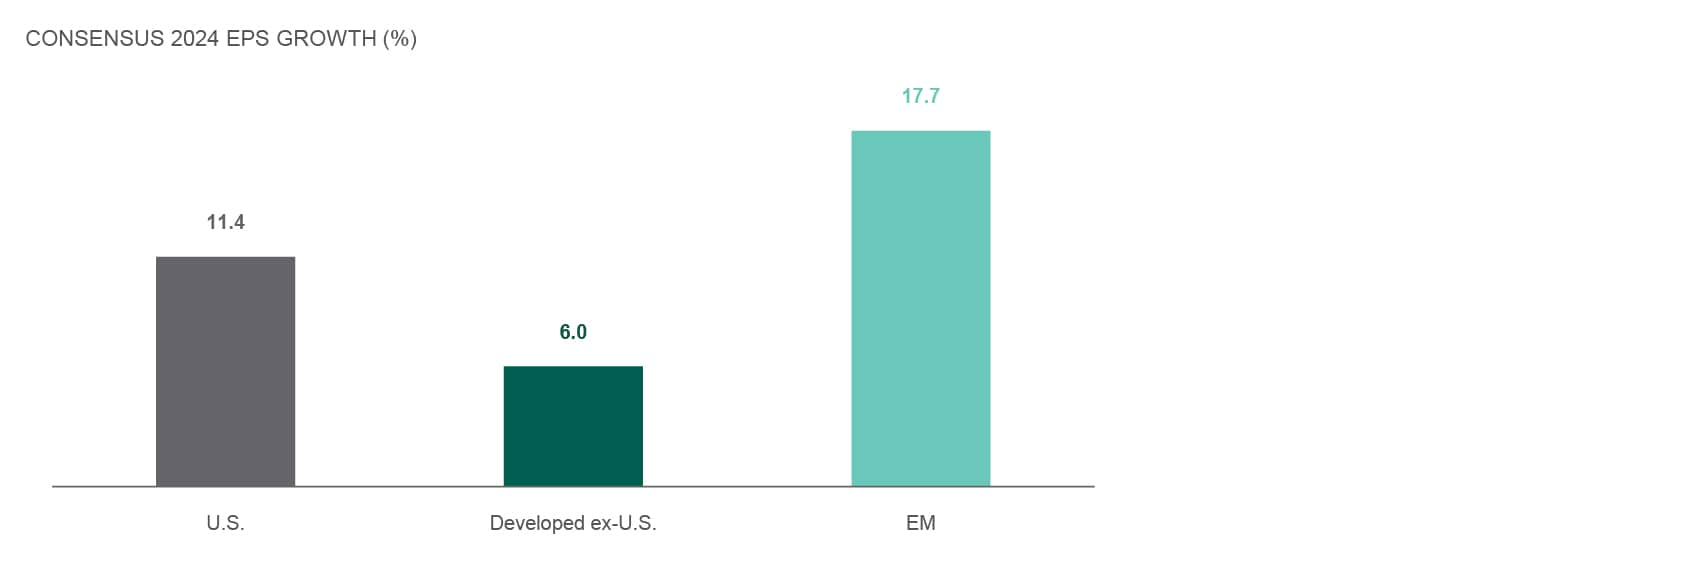
Source: Northern Trust Asset Management, FactSet. EPS = earnings per share. Emerging Markets = EM. S&P 500, MSCI World ex. U.S. and MSCI Emerging Markets Indices used as proxies for U.S., Developed ex.-U.S. and EM, respectively. EPS estimates are FactSet consensus estimates as of 1/5/2024. Historical trends are not predictive of future results.
- Investors are pricing in an earnings rebound across all regions, but most sharply in emerging markets.
- Easier Fed policy, a robust earnings growth outlook and more reasonable valuations should support emerging market equities (EM) in the year ahead.
- In light of a more balanced macroeconomic outlook, we removed our 1% underweight to EM.
Real Assets
Historically, global real estate (GRE) has shown a negative correlation to interest rate movements — and this was demonstrated again over the past two months as investors expressed comfort that the Fed tightening cycle is coming to an end. A more normalized rate environment should be a catalyst for real estate transactions as market participants will be able to put pencil to paper on property valuations and financing costs, utilizing the capital markets with a higher degree of certainty. Further, real estate should benefit from our base case expectation of an economic soft landing underpinned by a healthy consumer — both integral to sustained and growing rents.
With property revaluations nearly complete and financing costs more certain, we expect opportunities to develop in 2024. The office sector continues to garner significant media attention, but our focus has been on relatively healthy sectors positioned for structural growth (residential, industrial) as well as emerging sectors (cell towers, data centers, alternative residential). The valuation gap between private and public real estate has started to narrow, but public market prices still maintain a notable discount for most sectors. 2024 may develop into a pivot point for public and private real estate pricing as markets transition.
EXHIBIT 5: A REAL (ESTATE) PIVOT?
Real estate has started to outperform on Fed pivot hopes.
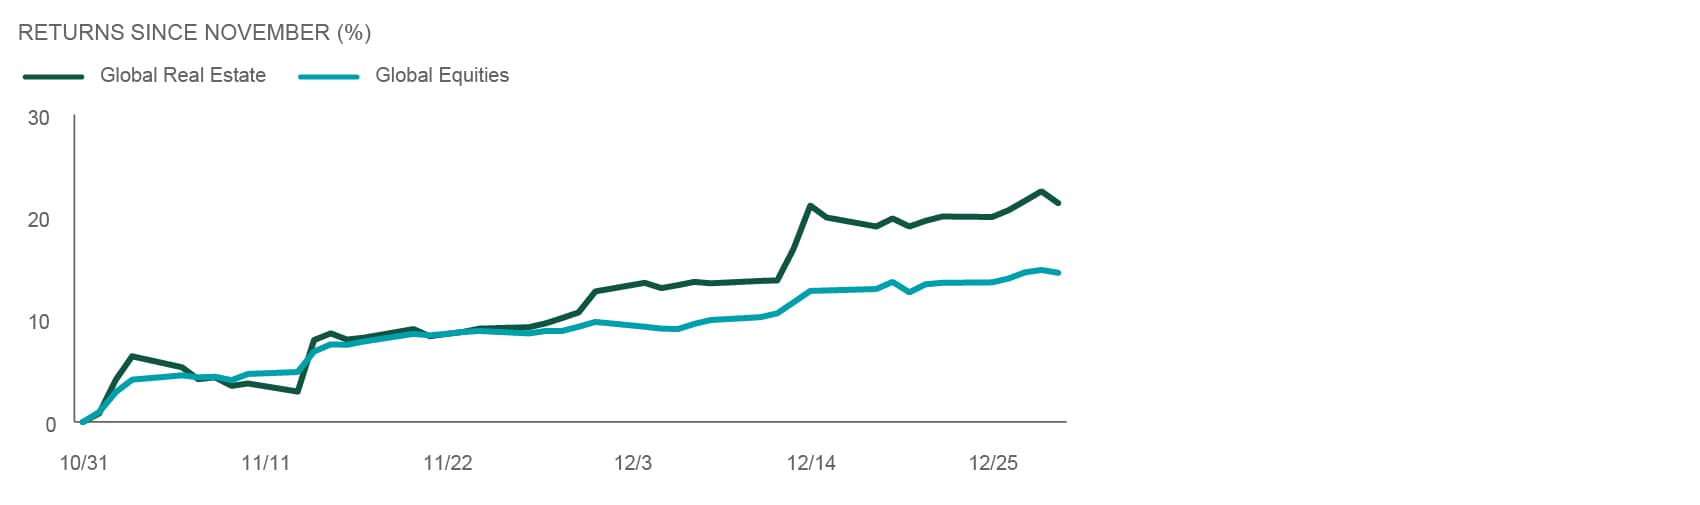
Source: Northern Trust Asset Management, Bloomberg. Data from 10/31/2023 through 12/31/2023. Index performance returns do not reflect any management fees, transaction costs or expenses. It is not possible to invest directly in any index. Past performance is no guarantee of future results.
- Real estate is a diversified asset class with exposure to term (interest rate), market and credit risk.
- An end to the Fed tightening cycle and a soft landing could provide an attractive environment for real estate.
- We are waiting for more realistic market expectations on rate cuts, but real estate could be at a pivot point.

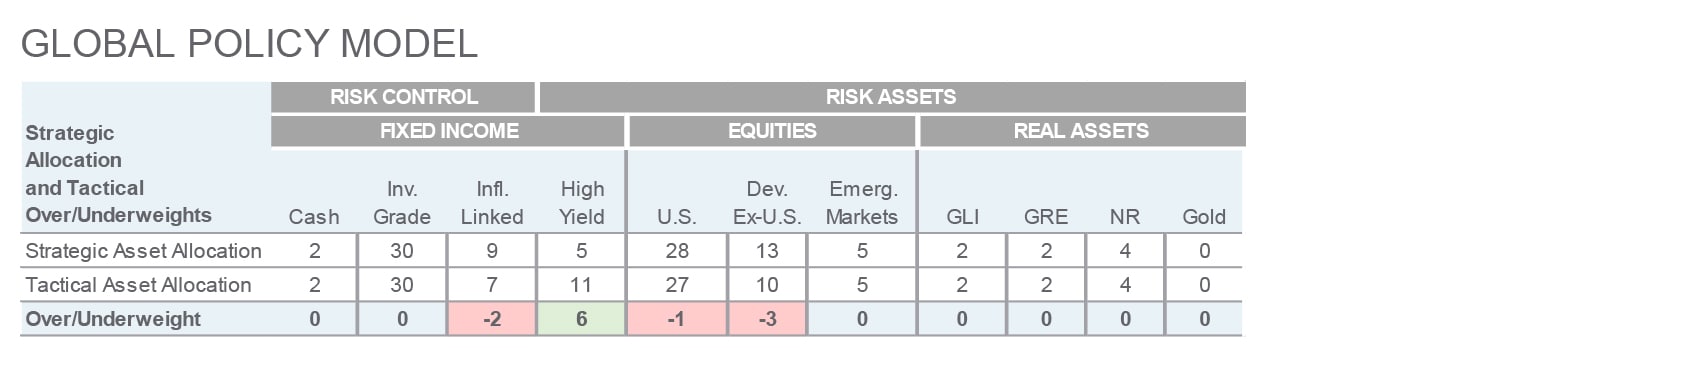
Source: Northern Trust Capital Market Assumptions Working Group, Investment Policy Committee. Strategic allocation is based on capital market return, risk and correlation assumptions developed annually; most recent model released 8/9/2023.The model cannot account for the impact that economic, market and other factors may have on the implementation and ongoing management of an actual investment strategy. Asset allocation does not guarantee a profit or protection against a loss in declining markets.
Main Point
Decoding Market Trends
In the face of ongoing geopolitical and economic challenges, we anticipate adopting a cautious stance toward market risks with expected moderate central bank easing, a likely soft landing for the U.S. economy, and a strategic shift favoring high yield bonds and selected equity markets.

Contact Us
Interested in learning more about our expertise and how we can help?
IMPORTANT INFORMATION
Northern Trust Asset Management (NTAM) is composed of Northern Trust Investments, Inc., Northern Trust Global Investments Limited, Northern Trust Fund Managers (Ireland) Limited, Northern Trust Global Investments Japan, K.K., NT Global Advisors, Inc., 50 South Capital Advisors, LLC, Northern Trust Asset Management Australia Pty Ltd, and investment personnel of The Northern Trust Company of Hong Kong Limited and The Northern Trust Company.
Issued in the United Kingdom by Northern Trust Global Investments Limited, issued in the European Economic Association (“EEA”) by Northern Trust Fund Managers (Ireland) Limited, issued in Australia by Northern Trust Asset Management (Australia) Limited (ACN 648 476 019) which holds an Australian Financial Services Licence (License Number: 529895) and is regulated by the Australian Securities and Investments Commission (ASIC), and issued in Hong Kong by The Northern Trust Company of Hong Kong Limited which is regulated by the Hong Kong Securities and Futures Commission.
For Asia-Pacific (APAC) and Europe, Middle East and Africa (EMEA) markets, this information is directed to institutional, professional and wholesale clients or investors only and should not be relied upon by retail clients or investors. This document may not be edited, altered, revised, paraphrased, or otherwise modified without the prior written permission of NTAM. The information is not intended for distribution or use by any person in any jurisdiction where such distribution would be contrary to local law or regulation. NTAM may have positions in and may effect transactions in the markets, contracts and related investments different than described in this information. This information is obtained from sources believed to be reliable, its accuracy and completeness are not guaranteed, and is subject to change. Information does not constitute a recommendation of any investment strategy, is not intended as investment advice and does not take into account all the circumstances of each investor.
This report is provided for informational purposes only and is not intended to be, and should not be construed as, an offer, solicitation or recommendation with respect to any transaction and should not be treated as legal advice, investment advice or tax advice. Recipients should not rely upon this information as a substitute for obtaining specific legal or tax advice from their own professional legal or tax advisors. References to specific securities and their issuers are for illustrative purposes only and are not intended and should not be interpreted as recommendations to purchase or sell such securities. Indices and trademarks are the property of their respective owners. Information is subject to change based on market or other conditions.
All securities investing and trading activities risk the loss of capital. Each portfolio is subject to substantial risks including market risks, strategy risks, advisor risk, and risks with respect to its investment in other structures. There can be no assurance that any portfolio investment objectives will be achieved, or that any investment will achieve profits or avoid incurring substantial losses. No investment strategy or risk management technique can guarantee returns or eliminate risk in any market environment. Risk controls and models do not promise any level of performance or guarantee against loss of principal. Any discussion of risk management is intended to describe NTAM’s efforts to monitor and manage risk but does not imply low risk.
Past performance is not a guarantee of future results. Performance returns and the principal value of an investment will fluctuate. Performance returns contained herein are subject to revision by NTAM. Comparative indices shown are provided as an indication of the performance of a particular segment of the capital markets and/or alternative strategies in general. Index performance returns do not reflect any management fees, transaction costs or expenses. It is not possible to invest directly in any index. Net performance returns are reduced by investment management fees and other expenses relating to the management of the account. Gross performance returns contained herein include reinvestment of dividends and other earnings, transaction costs, and all fees and expenses other than investment management fees, unless indicated otherwise. For U.S. NTI prospects or clients, please refer to Part 2a of the Form ADV or consult an NTI representative for additional information on fees.
Hypothetical portfolio information provided does not represent results of an actual investment portfolio but reflects representative historical performance of the strategies, funds or accounts listed herein, which were selected with the benefit of hindsight. Hypothetical performance results do not reflect actual trading. No representation is being made that any portfolio will achieve a performance record similar to that shown. A hypothetical investment does not necessarily take into account the fees, risks, economic or market factors/conditions an investor might experience in actual trading. Hypothetical results may have under- or over-compensation for the impact, if any, of certain market factors such as lack of liquidity, economic or market factors/conditions. The investment returns of other clients may differ materially from the portfolio portrayed. There are numerous other factors related to the markets in general or to the implementation of any specific program that cannot be fully accounted for in the preparation of hypothetical performance results. The information is confidential and may not be duplicated in any form or disseminated without the prior consent of (NTI) or its affiliates.
Forward-looking statements and assumptions are NTAM’s current estimates or expectations of future events or future results based upon proprietary research and should not be construed as an estimate or promise of results that a portfolio may achieve. Actual results could differ materially from the results indicated by this information.
Not FDIC insured | May lose value | No bank guarantee