Point of View
- Who We Serve
- What We Do
- About Us
- Insights & Research
- Who We Serve
- What We Do
- About Us
- Insights & Research
Investment Perspective · 07.17.25
Save to bookmarks
Front-Loaded Growth, Back-End Risk: Navigating the Tariff Timeline
Recent gains are notable, but the mix of tariffs, inflation, and policy uncertainty could complicate the road ahead.
- Portfolio Construction
- Fixed Income Insights
- High Yield Strategy
- Risk Management
Format
Change Format: Choose the format you prefer, and we'll remember your preference next time.
Front-Loaded Growth, Back-End Risk: Navigating the Tariff Timeline
Save to bookmarks
Save to bookmarks
Key Points
What it is
The blend of front-loaded trade activity and strong equity performance, especially in tech, has helped markets push higher, but the durability of that momentum remains unknown.
Why it matters
Short-term strength may be clouding longer-term risks, making it harder to gauge how durable current market trends really are.
Where it's going
While fundamentals remain supportive in some areas, a globally diversified approach may potentially offer an attractive risk-reward balance in the months ahead.
One must be wary of overestimating the resilience of the global economy. The complex interplay of tariffs and trade tensions has precipitated a notable phenomenon: the front-loading of activities, mostly in the manufacturing sector. This anticipatory behavior, driven by the uncertainty of future tariffs, has had a ripple effect, necessitating a thorough examination of current economic indicators.
Front-Loading in Manufacturing and Trade: The concept of front-loading is not merely a theoretical construct; it is a tangible reality evident in foreign trade data. For instance, Taiwan exports illustrate this phenomenon vividly. As concerns over sectoral tariffs on the technology sector escalate, a surge in export activities has been observed. Enterprises, motivated by the fear of imminent tariffs, have expedited their export processes to mitigate potential future losses. This preemptive behavior, while temporarily bolstering economic indicators, raises questions regarding the sustainability of such growth.
Economic Resilience Beyond Borders: Economic resilience is not confined to the U.S. alone; it extends to significant global players such as China. The first half of the year has showcased solid growth momentum in the Chinese economy. However, a more profound analysis reveals underlying vulnerabilities. The real estate sector, a substantial pillar of the Chinese economy, exhibits weak momentum. Moreover, as U.S. tariffs take effect, the export momentum that has underpinned much of China's growth could experience a significant deceleration.
Deflationary Forces in China: Compounding the complexity is the specter of deflationary forces that could intensify in China. The dumping of goods, previously destined for the U.S. market, into alternative markets could exert downward pressure on prices. This need to find new markets for surplus production could lead to a deflationary spiral, further complicating China's economic landscape.
The Equity Market Paradox: In stark contrast to these cautionary narratives, the equity markets have been on an upward climb, led predominantly by technology stocks. This paradox of rising equity markets amidst economic uncertainty necessitates a nuanced understanding. The technology sector, buoyed by innovation and consumer demand, is not immune to the broader economic forces at play. Investors must remain vigilant and discerning, avoiding the allure of market exuberance.
Bond Markets Under Pressure: Meanwhile, bond markets have begun to come under renewed pressure. The latest shift in U.S. tariff rhetoric, marked by a more aggressive stance, has heightened volatility. With U.S. inflation rates hovering closer to 3%, the Federal Reserve is in a precarious position. The Fed's reluctance to cut rates is compounded by the recently passed U.S. fiscal package, which has amplified fiscal sustainability worries.
— Peter Wilke, CFA – Head of Tactical Asset Allocation, Global Asset Allocation
Export Boom
Taiwan Exports to the U.S. (Year-Over-Year %)
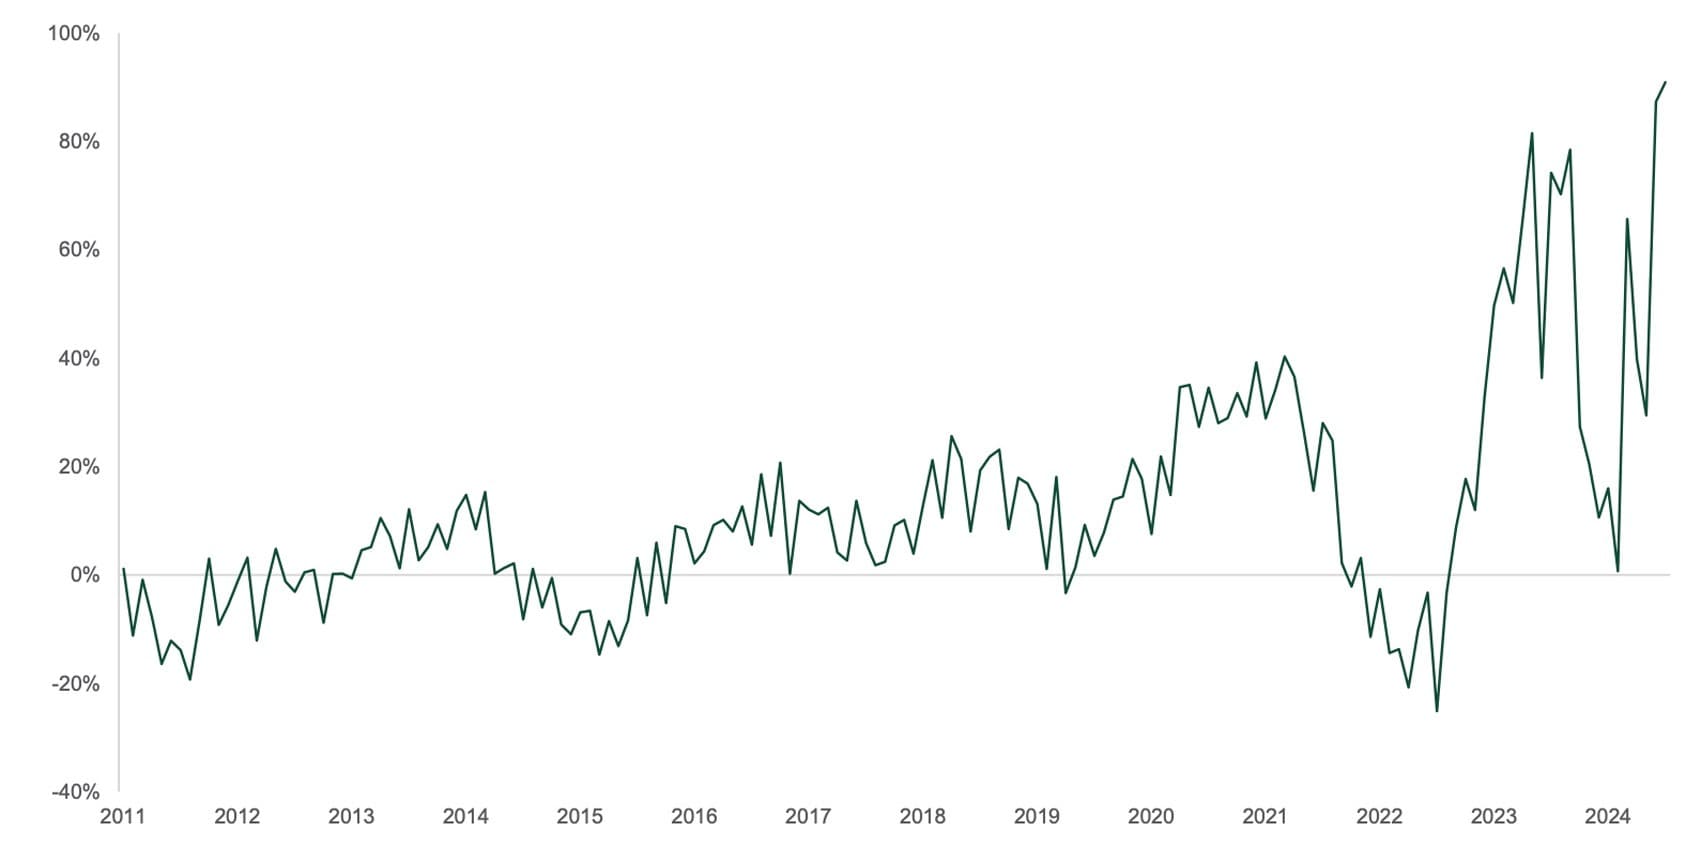
Source: Northern Trust Asset Management, Bloomberg. Data from 12/31/2011 through 6/30/2025.
Interest Rates
The One Big Beautiful Bill Act (OBBB) has two notable impacts on front-end U.S. rates. First, the OBBB increased the debt ceiling by $5 Trillion, removing the threat of technical default on certain Treasury securities. While many factors (e.g., fiscal and tax policy, prevailing interest rates) impact the Treasury’s borrowing needs under the debt ceiling, early estimates (with a wide margin of error) suggest the debt ceiling won’t be an issue for markets again for at least a couple of years. Strictly from the lens of money market functioning, this is a welcome development.
Second, Treasury Bill issuance will now increase markedly this quarter. The Treasury had been operating under extraordinary measures, meaning less bill issuance to remain under the ceiling. However, this leaves the Treasury with less cash-on-hand than it typically targets. The Treasury General Account (TGA) fell to $313 Billion by early July. Simply returning the TGA to a previously stated target of $850 Billion by the end of 3Q implies more than half a trillion in net T-Bill issuance in short order. While this uptick may cause some minor, temporary indigestion in the money markets, we don’t anticipate large-scale disruptions and suspect higher will be met with demand.
— Dan LaRocco, Head of U.S. Liquidity, Global Fixed Income
Treasury Set to Refill Its Coffers
Treasury Bill issuance is set to rise in the coming months
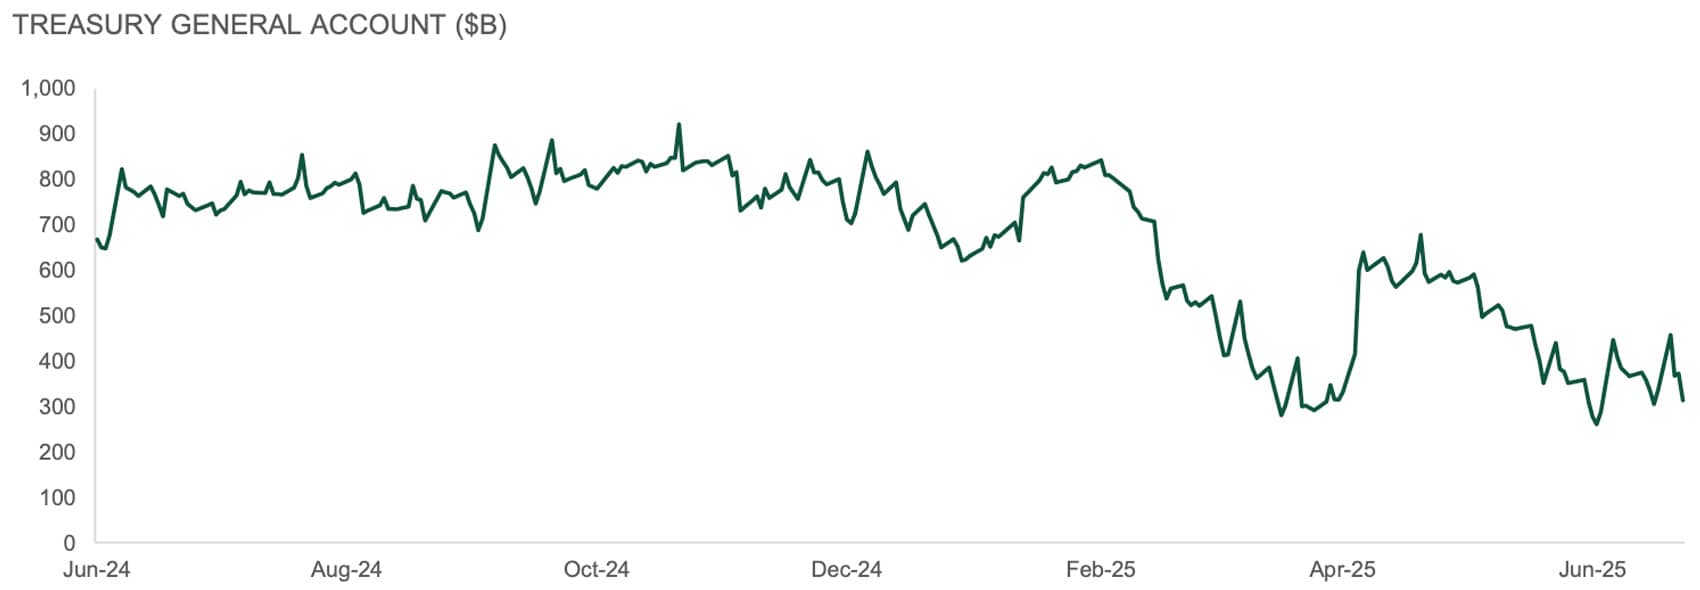
Source: Northern Trust Asset Management, Bloomberg. Data from 6/11/2024 through 7/3/2025. Historical trends are not predictive of future results.
- The OBBB increased the debt ceiling by $5 Trillion, removing the near-term threat of technical default.
- Treasury Bill issuance will now increase substantially this quarter.
- While this uptick may cause some minor, temporary indigestion in the market, we don’t anticipate large-scale disruptions.
Credit Markets
Risk assets continued to rally in June despite rising geopolitical tensions. Credit markets pushed higher. Spread tightening, declining Treasury yields and coupon income helped produce the highest monthly return for the high yield market in nearly a year. With spreads back to the low end of the year-to-date range, the amount of new issuance for June has been no surprise. With $37 billion pricing, it has been the busiest month since September.
The amount of senior secured bonds as a percentage of the high yield index is at a record high 35%, which has contributed to structurally tighter spreads overall. The average basis of secured and unsecured bonds are about 180 currently. In addition, senior secured bonds have accounted for 42% of high yield issuance year-to-date following 45% in 2024 and a record high 59% in 2023. Given these changes in the composition of the high yield market, fundamentals continue to hold in well as the high yield default rate is at 1.4% as of June versus the long-term average of 3.4%. This has helped support current valuations.
— Ben McCubbin, Co-Head of High Yield, Global Fixed Income
— Sau Mui, Co-Head of High Yield, Global Fixed Income
More Security
The amount of senior secured bonds as a percentage of the high yield index is at a record high.
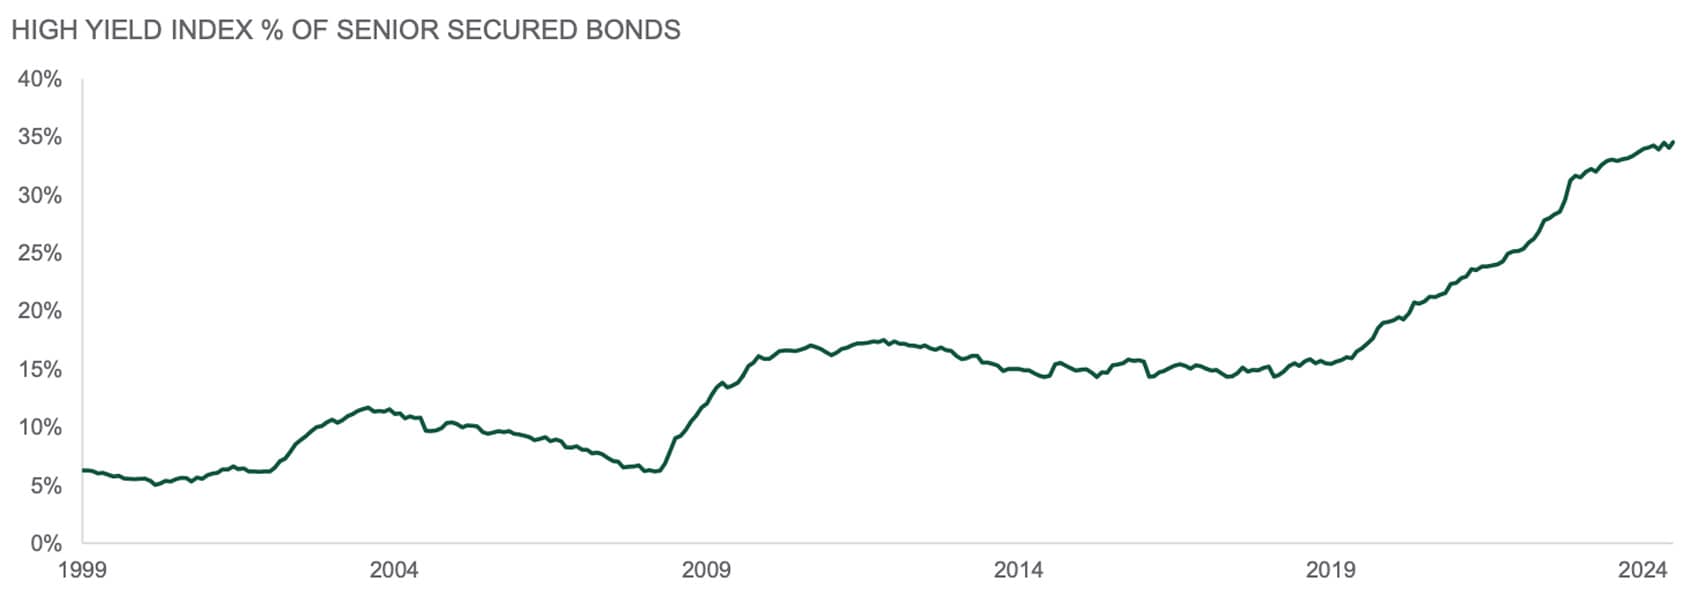
Source: Northern Trust Asset Management, JPMorgan. Data for JPMorgan High Yield (HY) Index from 12/31/1999 through 6/23/2025. Historical trends are not predictive of future results. It is not possible to invest directly in any index.
- In June, high yield produced its highest monthly return in nearly a year.
- Senior secured bonds now make up 35% of the high yield index. This is a record proportion.
- With support from composition changes, fundamentals are healthy and supporting current valuations.
Equities
Markets rallied in June to put a bow on the best quarter since Q4 of 2023. Strength was global with U.S. Equities up 11.4%, Developed ex-U.S. up 12.1%, and Emerging Markets up 12.0%. The quarter resembled 2024 in many ways with the Mag 7 leading the way – outside of Apple – and cyclicals outpacing defensives by 17.1%. Breadth was narrow with less than 30% of stocks outperforming the benchmark. July began with renewed tariff concern even as the July 9 tariff deadline was temporarily pushed back. Tariff impacts will continue to be a focus as quarterly earnings kick off in mid-July. In Q1, earnings beats were slightly above historical norms with only a small number of companies pulling or lowering guidance. We expect that to be the case again in Q2. Earnings growth is expected to be around 6% year-over-year in Q2.
Fundamentals remain strong in the U.S., even with growth expectations having declined throughout the year. However, with valuations in the U.S. near recent highs, especially in the growth segment of the market, we see better risk-reward outside of the U.S. We therefore maintain a neutral position in U.S. Equities and an overweight to Developed ex-U.S. Equities.
— Jordan Dekhayser, Head of Equity Client Portfolio Management
Concentrating
U.S. market breadth narrowed in the second quarter.
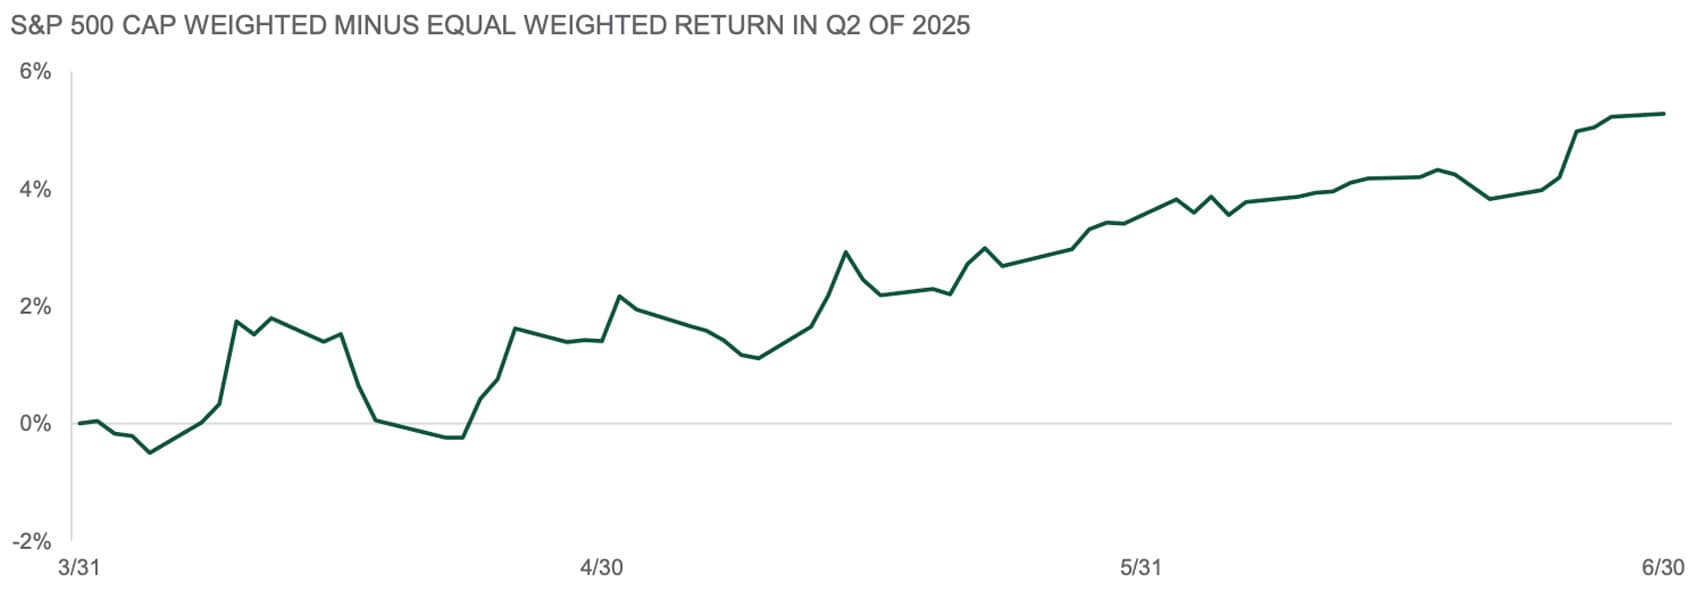
Source: Northern Trust Asset Management, Bloomberg. Total returns from 3/31/2025 through 6/30/2025. Past performance is not indicative or a guarantee of future results. Index performance returns do not reflect any management fees, transaction costs or expenses. It is not possible to invest directly in any index. Historical trends are not predictive of future results.
- Markets continued rallying in June, with investors ignoring the adage of “sell in May and go away”.
- Narrow breadth in the second quarter resembled the market environment in 2024.
- Fundamentals and valuations in the U.S. are roughly balanced. We remain equal-weight U.S. Equities, with a preference for developed ex-U.S. markets.
Real Assets
In March, began to reverse policy and announced monthly increases in crude production. These announcements to hike supply shifted investor focus back to oil market supply/demand fundamentals. The moves signaled a strategic shift to the normalization of spare capacity and inventories and a reclamation of lost market share. Last week, OPEC+ announced a 0.55 million barrel per day increase in required crude production for August, which was above consensus expectations. To justify the increase in production, OPEC+ released a statement citing a “steady global economic outlook and healthy market fundamentals, as reflected in the low oil inventories”, but the full rationale remains ambiguous. Market focus now turns to the August announcement of September production. For now, fundamental supply and demand metrics appear healthy and resilient global demand has kept crude pricing rangebound.
Investing in commodities and global natural resource equities can provide protection against geopolitical risks and unanticipated inflation. We remain equal-weight natural resource equities relative to its strategic weight, and have a stronger preference for listed infrastructure.
— Jim Hardman, Head of Real Assets, Multi-Manager Solutions
Production Push
OPEC+ has started to increase crude production.
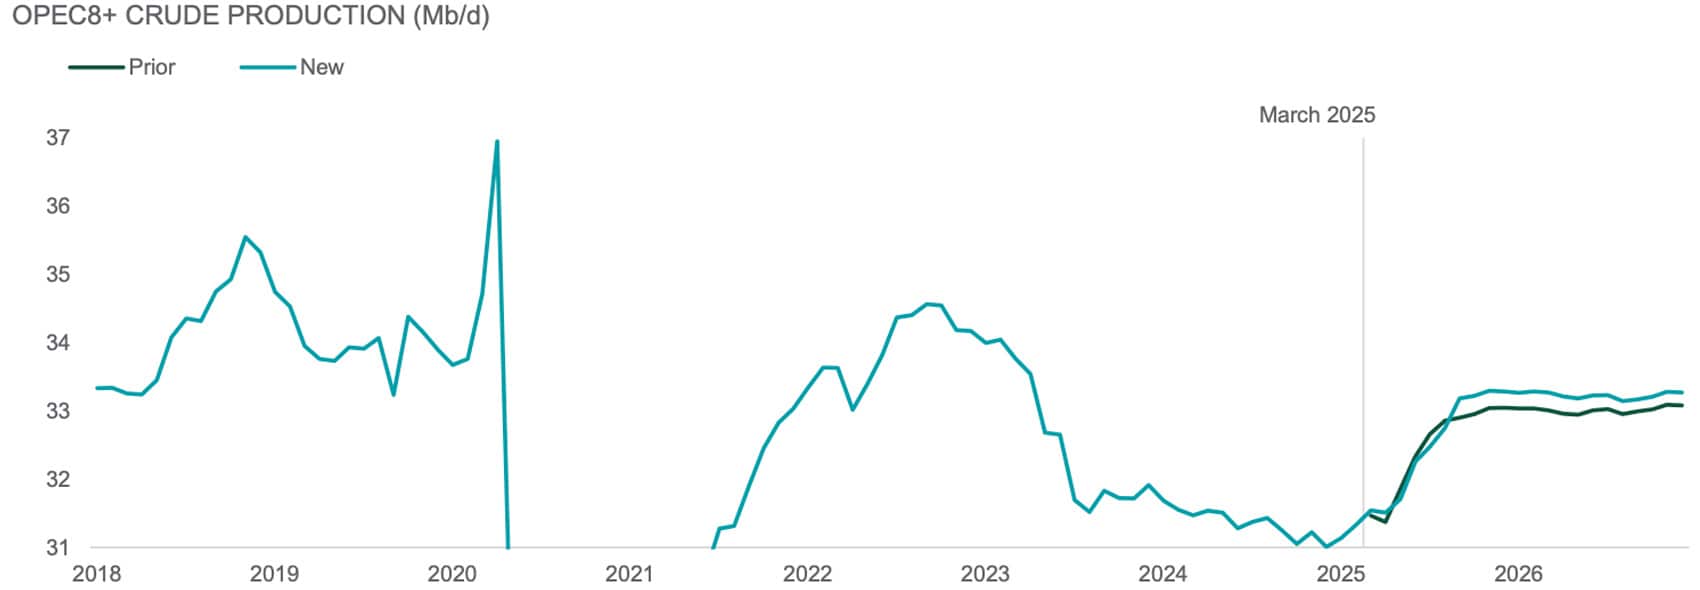
Source: Northern Trust Asset Management, IEA, Petro-Logistics, Kpler, IIR, JODI, OPEC, Goldman Sachs Investment Research. OPEC8+ includes Russia, Saudi Arabia, UAE, Iraq, Kuwait, Algeria, Oman and Kazakhstan. Mb/d is million barrels per day. Y-axis intentionally truncated – series minimum is 27.2. Historical trends are not predictive of future results.
- OPEC+ has begun to unwind output cuts and resume monthly increases in planned production.
- The market has a renewed focus on supply and demand fundamentals and resilient global demand has kept pricing rangebound
- We reaffirmed our equal-weight positioning in natural resource equities.
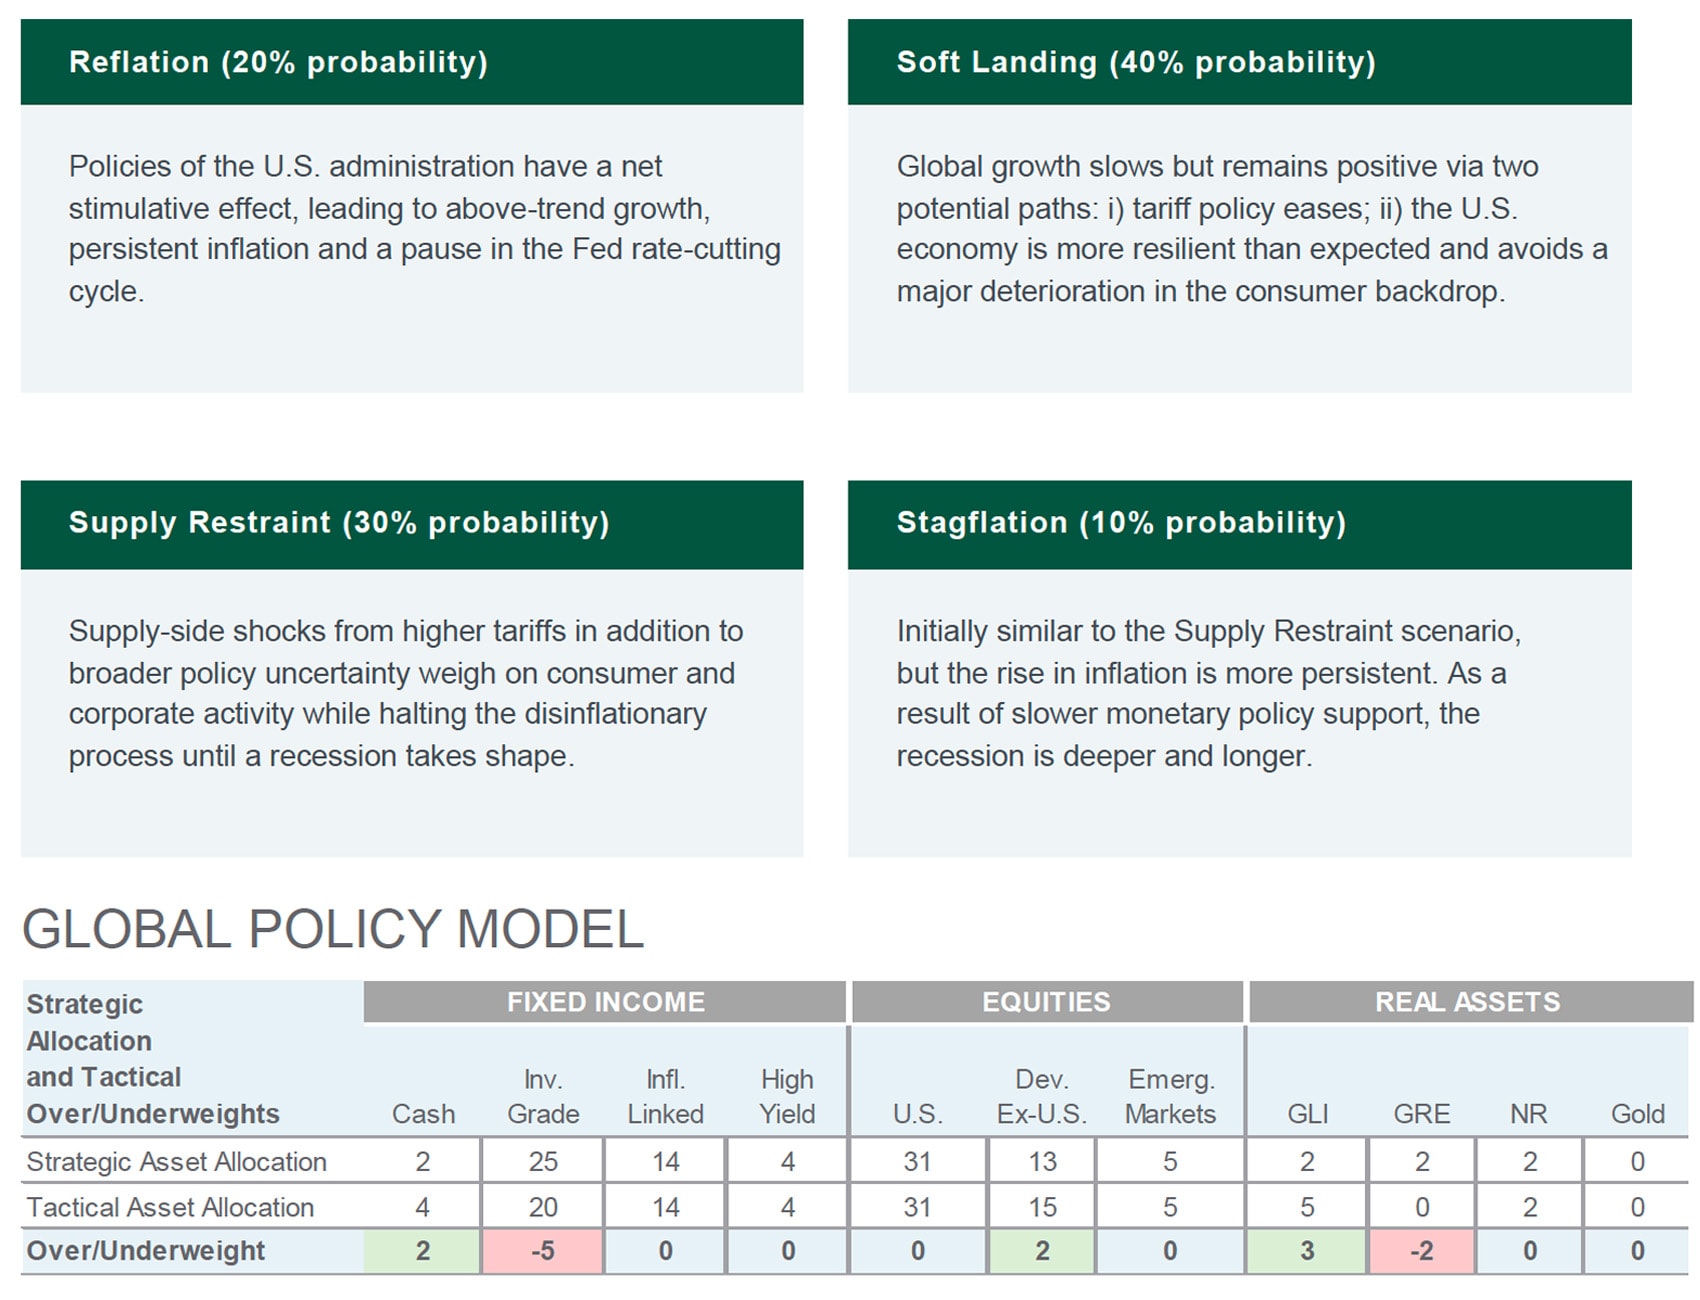
Source: Northern Trust Capital Market Assumptions Working Group, Investment Policy Committee. Strategic allocation is based on capital market return, risk and correlation assumptions developed annually; most recent model released 1/15/2025. The model cannot account for the impact that economic, market and other factors may have on the implementation and ongoing management of an actual investment strategy. Asset allocation does not guarantee a profit or protection against a loss in declining markets. GLI = Global Listed Infrastructure, GRE = Global Real Estate, NR = Natural Resources. Unless otherwise noted, the statements expressed herein are solely opinions of Northern Trust. Northern Trust does not make any representation, assurance, or other promise as to the accuracy, impact, or potential occurrence of any events or outcomes expressed in such opinions.
Unless noted otherwise, data is sourced from Bloomberg as of July 2025.
Main Point
Growth Now, Risk Later? Navigating Tariff Tensions
While recent data shows strength in trade and equities, much of that momentum may reflect short-term responses to policy uncertainty. With tariffs in flux and inflation still elevated, the outlook remains complex, and investors may want to stay alert as condition could quickly shift.

Contact Us
Interested in learning more about our expertise and how we can help?
IMPORTANT INFORMATION
The information contained herein is intended for use with current or prospective clients of Northern Trust Investments, Inc (NTI) or its affiliates. The information is not intended for distribution or use by any person in any jurisdiction where such distribution would be contrary to local law or regulation. Northern Trust Asset Management’s (NTAM) and its affiliates may have positions in and may effect transactions in the markets, contracts and related investments different than described in this information. This information is obtained from sources believed to be reliable, its accuracy and completeness are not guaranteed, and is subject to change. Information does not constitute a recommendation of any investment strategy, is not intended as investment advice and does not take into account all the circumstances of each investor.
This information is provided for informational purposes only and is not intended to be, and should not be construed as, an offer, solicitation or recommendation with respect to any transaction and should not be treated as legal advice, investment advice or tax advice. Recipients should not rely upon this information as a substitute for obtaining specific legal or tax advice from their own professional legal or tax advisors. References to specific securities and their issuers are for illustrative purposes only and are not intended and should not be interpreted as recommendations to purchase or sell such securities. Indices and trademarks are the property of their respective owners. Information is subject to change based on market or other conditions.
All securities investing and trading activities risk the loss of capital. Each portfolio is subject to substantial risks including market risks, strategy risks, advisor risk, and risks with respect to its investment in other structures. There can be no assurance that any portfolio investment objectives will be achieved, or that any investment will achieve profits or avoid incurring substantial losses. No investment strategy or risk management technique can guarantee returns or eliminate risk in any market environment. Risk controls and models do not promise any level of performance or guarantee against loss of principal. Any discussion of risk management is intended to describe NTAM’s efforts to monitor and manage risk but does not imply low risk.
Past performance is not a guarantee of future results. Performance returns and the principal value of an investment will fluctuate. Performance returns contained herein are subject to revision by NTAM. Comparative indices shown are provided as an indication of the performance of a particular segment of the capital markets and/or alternative strategies in general. Index performance returns do not reflect any management fees, transaction costs or expenses. It is not possible to invest directly in any index. Net performance returns are reduced by investment management fees and other expenses relating to the management of the account. Gross performance returns contained herein include reinvestment of dividends and other earnings, transaction costs, and all fees and expenses other than investment management fees, unless indicated otherwise. For U.S. NTI prospects or clients, please refer to Part 2a of the Form ADV or consult an NTI representative for additional information on fees.
Forward-looking statements and assumptions are NTAM’s current estimates or expectations of future events or future results based upon proprietary research and should not be construed as an estimate or promise of results that a portfolio may achieve. Actual results could differ materially from the results indicated by this information. Historical trends are not predictive of future results.
Northern Trust Asset Management is composed of Northern Trust Investments, Inc., Northern Trust Global Investments Limited, Northern Trust Fund Managers (Ireland) Limited, Northern Trust Global Investments Japan, K.K., NT Global Advisors, Inc., 50 South Capital Advisors, LLC, Northern Trust Asset Management Australia Pty Ltd, and investment personnel of The Northern Trust Company, The Northern Trust Company (Singapore Branch), and The Northern Trust Company of Hong Kong Limited.
Not FDIC insured | May lose value | No bank guarantee