Point of View
- Who We Serve
- What We Do
- About Us
- Insights & Research
- Who We Serve
- What We Do
- About Us
- Insights & Research
Investment Perspective · 06.18.25
Save to bookmarks
Geopolitics, Debt & Deficits, and the Tech Supercycle
Markets are weighing geopolitical risk, fiscal strain, and AI-fueled optimism, prompting investors to focus on resilience, selectivity, and the staying power of recent equity gains.
- Portfolio Construction
- Fixed Income Insights
- High Yield Strategy
- Risk Management
Format
Change Format: Choose the format you prefer, and we'll remember your preference next time.
Geopolitics, Debt & Deficits, and the Tech Supercycle
Save to bookmarks
Save to bookmarks
Key Points
What it is
Geopolitical instability, rising government debt, and accelerating AI adoption are converging to help shape market sentiment and asset allocation.
Why it matters
Investors are navigating a landscape marked by structural shifts, valuation pressure, and uneven global growth, all of which demand greater selectivity and resilience.
Where it's going
We remain focused on resilience and selectivity, favoring non-U.S. equities and infrastructure as markets navigate uncertainty and evolving growth drivers.
In today's dynamic financial landscape, three major themes interplay to shape market movements: Geopolitics, Debt & Deficits, and The Tech Supercycle. These forces are intricately connected, influencing investor sentiment and global economic trends.
Geopolitics: We are navigating an environment characterized by a multipolar world. Territorial disputes and fears surrounding nuclear rearmament persist, presenting significant challenges to global stability. Despite the desire of the U.S. to reduce its international engagements, it remains the principal military power capable of mitigating global disorder. This is evident through its support for Ukraine, facilitating a ceasefire between India and Pakistan, and its recent endeavors to negotiate with Iran to abandon its nuclear ambitions.
The uncertainty creates powerful investment implications. It is likely to lead to increased spending on military capabilities around the globe. In addition, the risk premium in commodity markets is likely to persist and investors should be prepared for potential supply disruptions.
Debt & Deficits: The last few years have witnessed an uptrend in government debt worldwide, primarily driven by fiscal support measures implemented in response to the COVID pandemic. Over the next five years, trends in fiscal consolidation are poised to diverge notably. The U.S. exemplifies a nation postponing the balancing of its budget until later in the decade, sustaining a substantial deficit of around 5-7% to bolster its economy. This increase in debt levels is anticipated to limit funding availability for the corporate sector, potentially burdening it with higher funding costs. Other parts in the developed world are on a more decisive path of fiscal consolidation, which should support their local government bonds as safe havens for investors.
The Tech Supercycle: Artificial Intelligence (AI) has transitioned from being a mere tool to a foundational layer across numerous sectors. This transformation is reinforced by the rapid expansion of digital infrastructure, including 5G, cloud computing, and the establishment of additional data centers (global data center demand is expected to grow by a 15% CAGR (Compounded Annual Growth Rate) to 152 gigawatts in 2030 – Royal Bank of Canada). These trends appear sustainable and robust, exhibiting resilience against short-term economic volatility.
The recent earnings season highlighted firms' confidence in AI-driven growth and resilient cloud performance. Companies are aggressively pursuing capital returns, reflecting their optimism in leveraging technological advancements to drive future profitability.
Conclusion: These themes are interconnected, and markets engage with and are propelled by the forces they generate. These forces significantly impact our research perspective through which investment riskiness is assessed, prioritizing resilience and adaptability in volatile environments.
— Peter Wilke, CFA – Head of Tactical Asset Allocation, Global Asset Allocation
TECH EARNINGS SUPPORT
Megacap tech’s advancement in innovation is expected to drive continued earnings growth dominance.
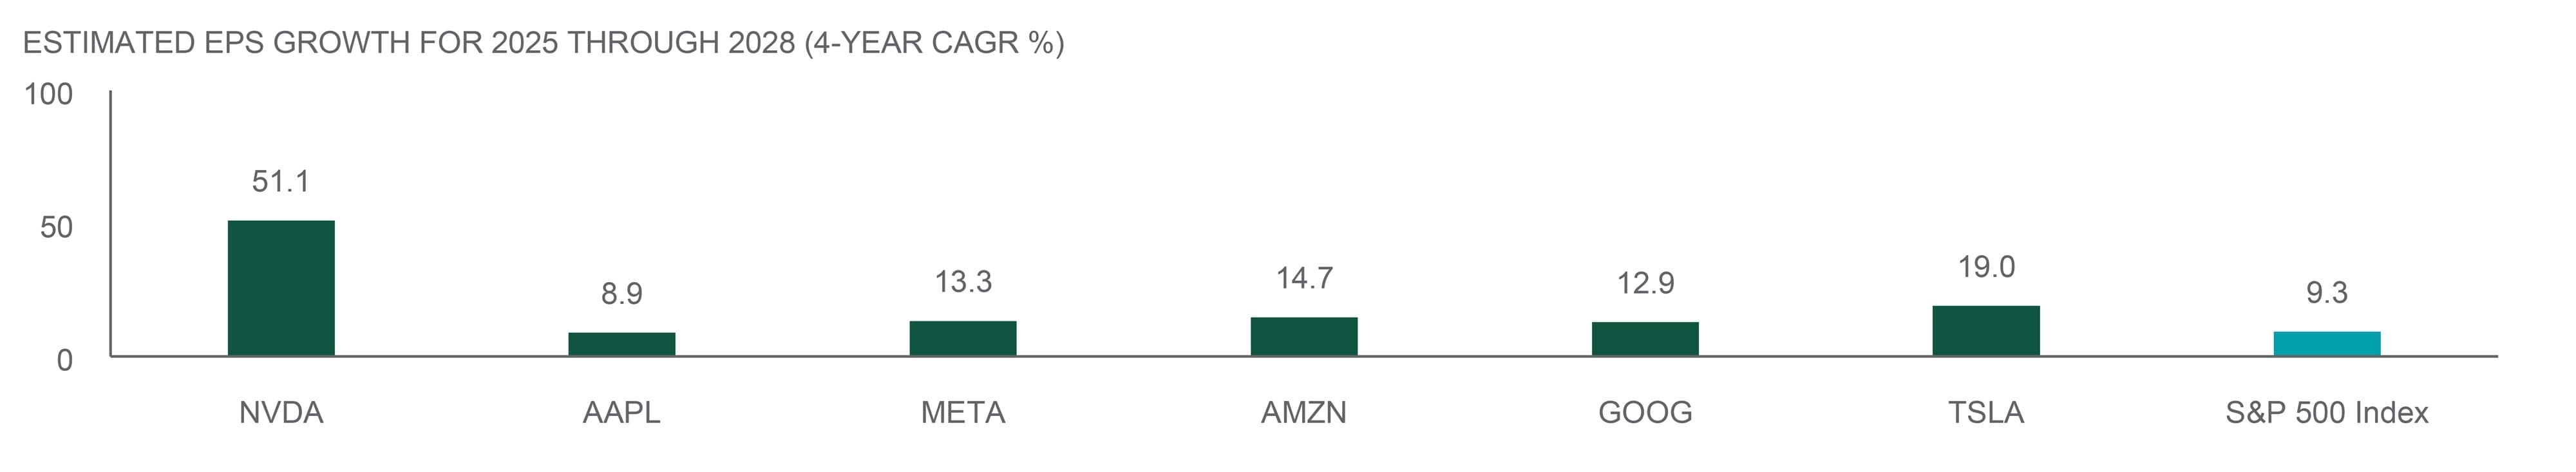
Source: Northern Trust Asset Management, Bloomberg. Annual estimates for 2025-2028 as of 6/17/2025. NVDA = Nvidia. AAPL = Apple. AMZN = Amazon. GOOG = Google. TSLA = Tesla. META = Meta Platforms. Historical trends are not predictive of future results. EPS = earnings per share.
Interest Rates
How have U.S. Treasury auction results been? While a handful of U.S. Treasury auction results drew attention in April, we haven’t seen a widespread shift in demand across the curve in recent auctions. in particular have seen solid demand as net supply is currently negative. Precisely determining “foreign demand” in real time is quite difficult, but, on the whole, investor demand doesn’t appear to have shifted as definitively as some press reports may lead you to believe.
Are there any signs that investors are changing their allocations to cash assets like MMFs (Money Market Funds)? MMF assets at the industry level have been growing this year, albeit at a slower pace than the strong run up seen during the prior 2 years. Instead of a shift in cash allocations, which largely held steady even during April of this year, perhaps we’re seeing cash allocations being maintained around all-time highs as measured by industry assets under management.
Are there potential policy changes on the horizon that you’re watching? Details around the implementation of central clearing of U.S. Treasuries, potential design changes of the Standing Repo Facility, as well as potential changes to the Supplementary Leverage Ratio.
— Dan LaRocco, Head of U.S. Liquidity, Global Fixed Income
U.S. BILL NET SUPPLY HAS BEEN NEGATIVE RECENTLY
U.S. bills outstanding have fallen since the start of 2025
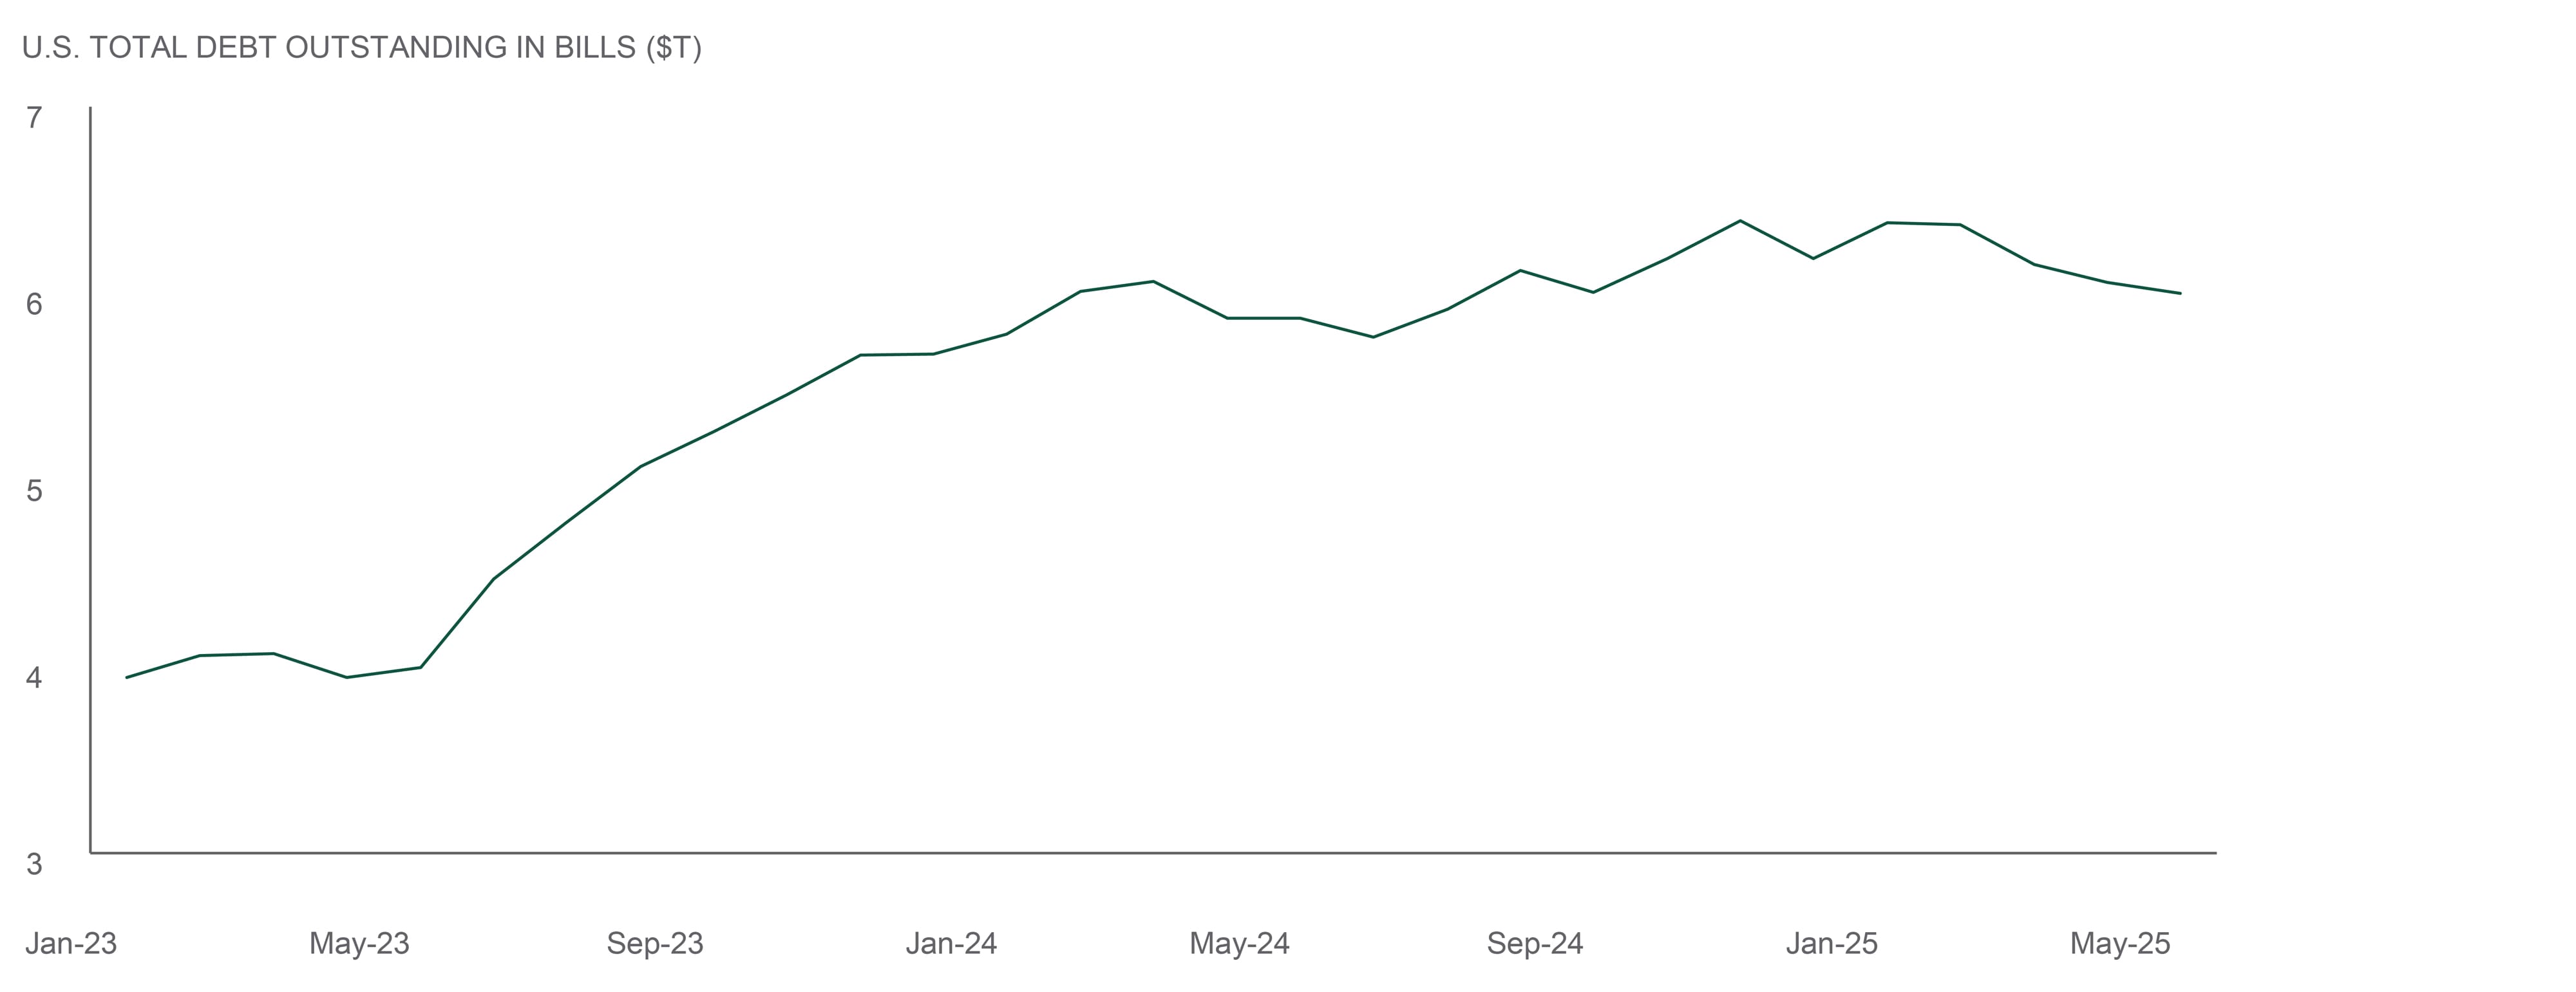
Source: Northern Trust Asset Management, Bloomberg. Data from 1/31/2023 to 6/10/2025. Historical trends are not predictive of future results.
- Despite some attention-grabbing Treasury auctions in April, overall demand — especially for T-Bills — remains solid, with no broad signs of investor fatigue.
- Cash allocations like money market funds continue to grow, though more gradually, suggesting investors are maintaining high cash levels rather than reallocating.
- We’re closely monitoring potential policy shifts that could reshape Treasury market dynamics such as central clearing, repo facility tweaks, and leverage ratio changes.
Credit Markets
High yield (HY) saw solid performance last month with the strongest monthly spread performance since 2023. Despite some volatility in the rates market, HY spread tightening offset negative impacts from duration, resulting in attractive absolute returns. As trade tensions eased, capital markets activity resumed. In May, $32 billion of HY gross issuance represented substantial increases in monthly volume from the tariff-induced market slowdown in April.
While HY supply was elevated last month, technicals continued to be favorable with HY producing its 5th consecutive supply deficit year-to-date due to continued strong organic inflows. Year-to-date, Calls ($55.5bn), Tenders ($11.3bn), and Maturities ($21.3bn) totaling $88.1bn compares to $105.8bn of gross new-issuance year-to-date. Meanwhile, coupon reinvestment ($28.5bn, assumes 75% reinvestment rate) and retail inflows (+$1.8bn) total $30.3bn. With Fallen Angels exceeding by $10.8bn, the high-yield bond market has produced a supply deficit of -$1.4bn in 2025 year-to-date following four consecutive years of supply deficits (-$496bn aggregated).
— Ben McCubbin, Co-Head of High Yield, Global Fixed Income
— Sau Mui, Co-Head of High Yield, Global Fixed Income
HIGH YIELD Supply and Demand Imbalance
High yield (HY) saw solid performance last month with the strongest monthly spread performance since 2023.
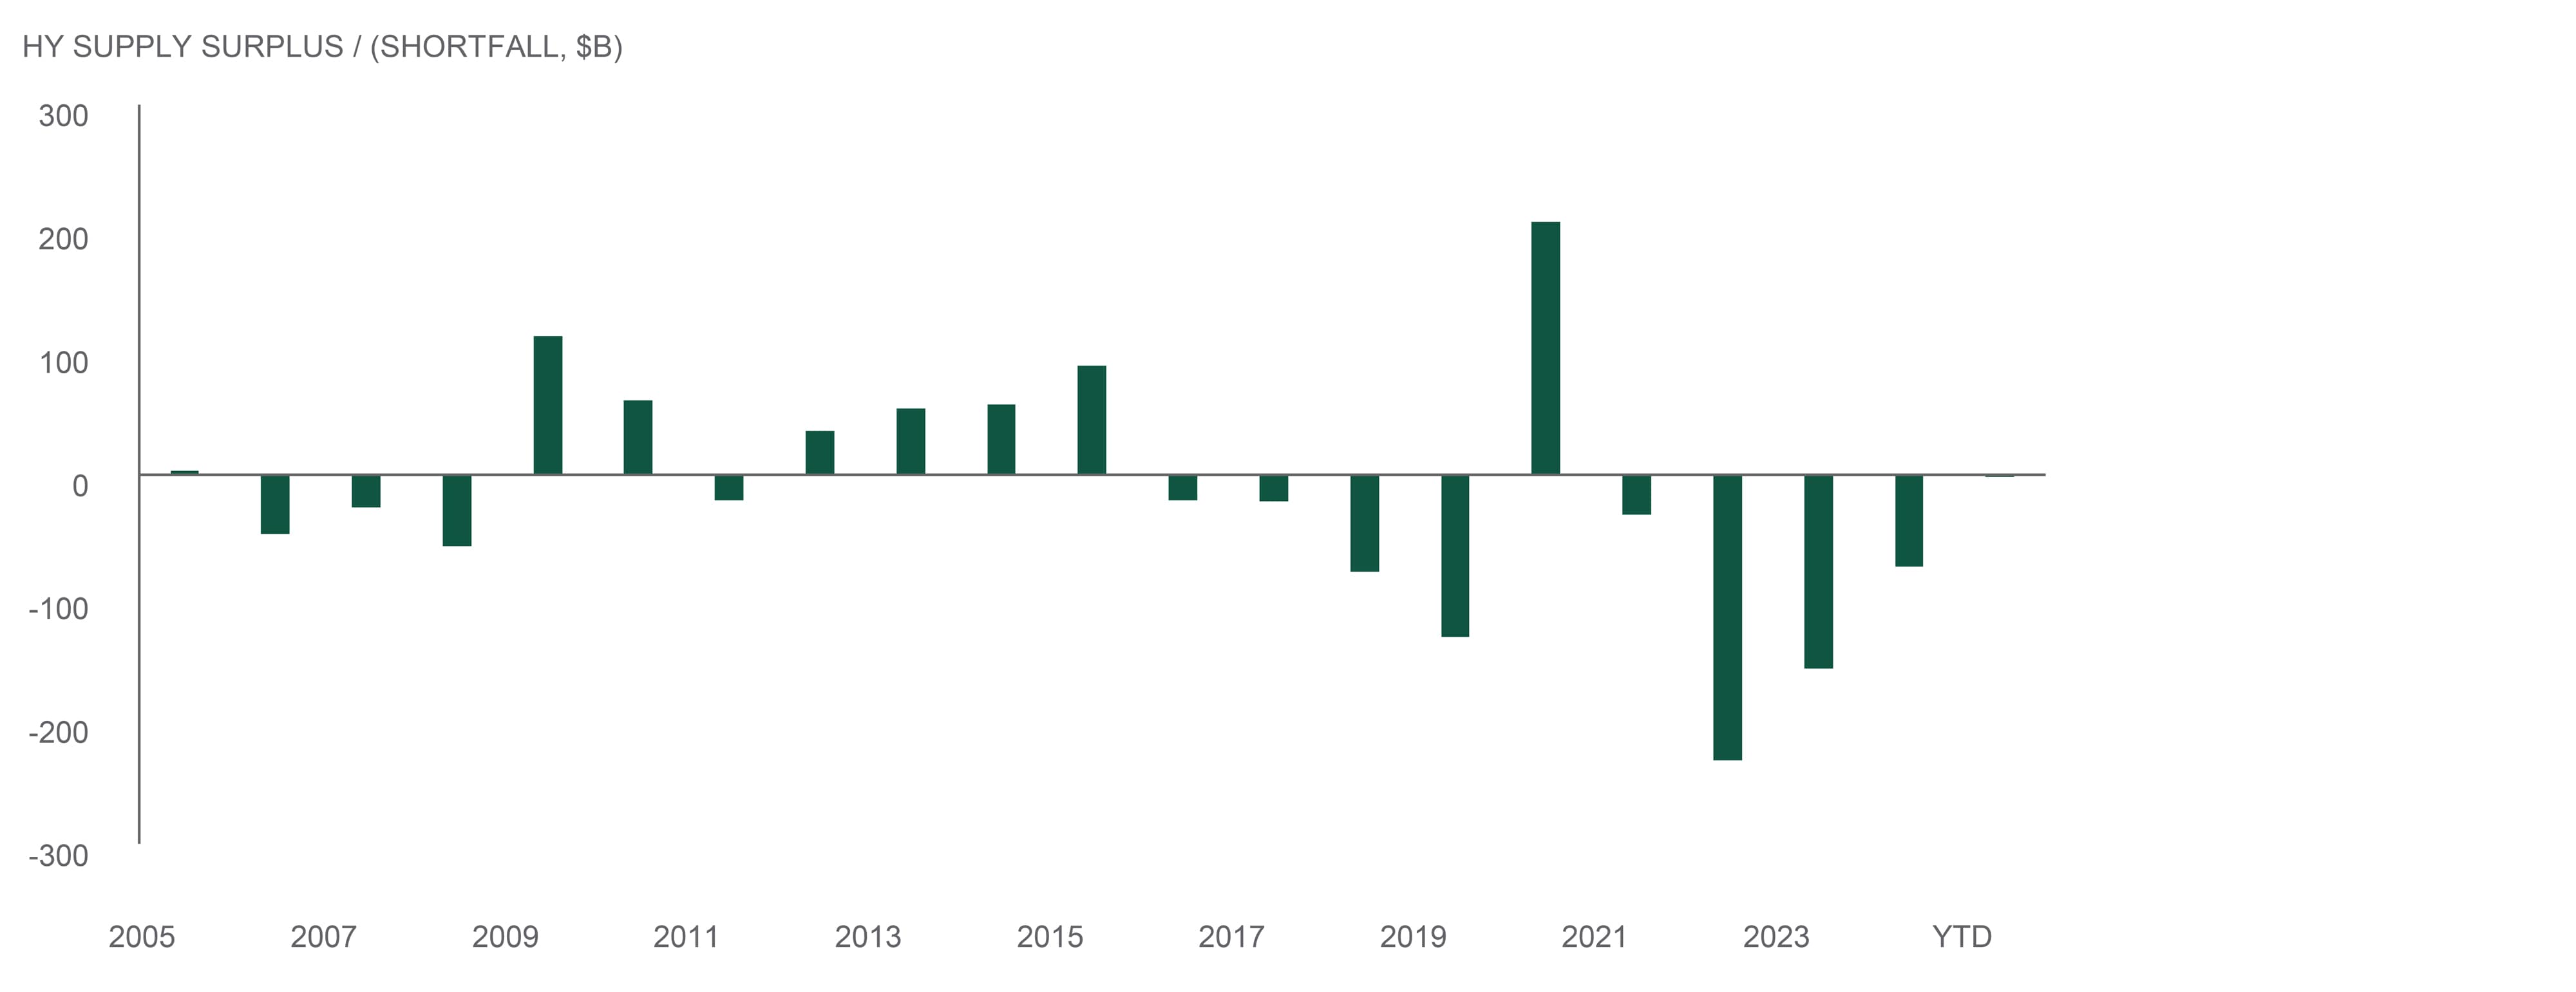
Source: Northern Trust Asset Management, J.P. Morgan. Data as of 5/28/2025. Historical trends are not predictive of future results.
- In May, $32 billion of gross issuance priced in the high yield bond market representing substantial increases in monthly volume from the tariff-induced market slowdown in April.
- While high yield supply was elevated last month, technicals continued to be favorable with high yield producing its 5th consecutive supply deficit year-to-date due to continued strong organic inflows.
- The high-yield bond market has produced a supply deficit of -$1.4 billion in 2025 year-to-date.
Equities
Across 2025 year-to-date – global equities are up 7% with notable separation between U.S. equities (+2%) and strong gains (in dollar terms) in both non-U.S. developed (+18%) and emerging market equities (+12%). U.S. equities have gained back a little ground over the last month with some help from the resurgence in megacap tech. Cyclical areas of the market performed better than defensive areas over this stretch. Non-U.S. equity returns continue to benefit from decent performance in local currency terms plus currency impacts when in dollar terms.
The S&P 500 widened back out to a little under 22x, above 2024 year end and not far below February’s peak, reflecting reduced fear of meaningful disruption from trade policy. There continues to be a bifurcation between Megacap tech and non-megacap tech earnings contributions. Some of the potential tariff headwinds that are not embedded in company guidance skews risk to the downside in earnings expectations. Although the tech rally could continue to support U.S. equities, we do not believe it is a good environment to take a sizable position in either direction. Instead, we prefer non-U.S. developed equities within our tactical equity allocation.
— Christian Lambert, Investment Analyst, Global Asset Allocation
Valuations have bounced back
S&P 500 P/E widened above 2024 year-end levels.
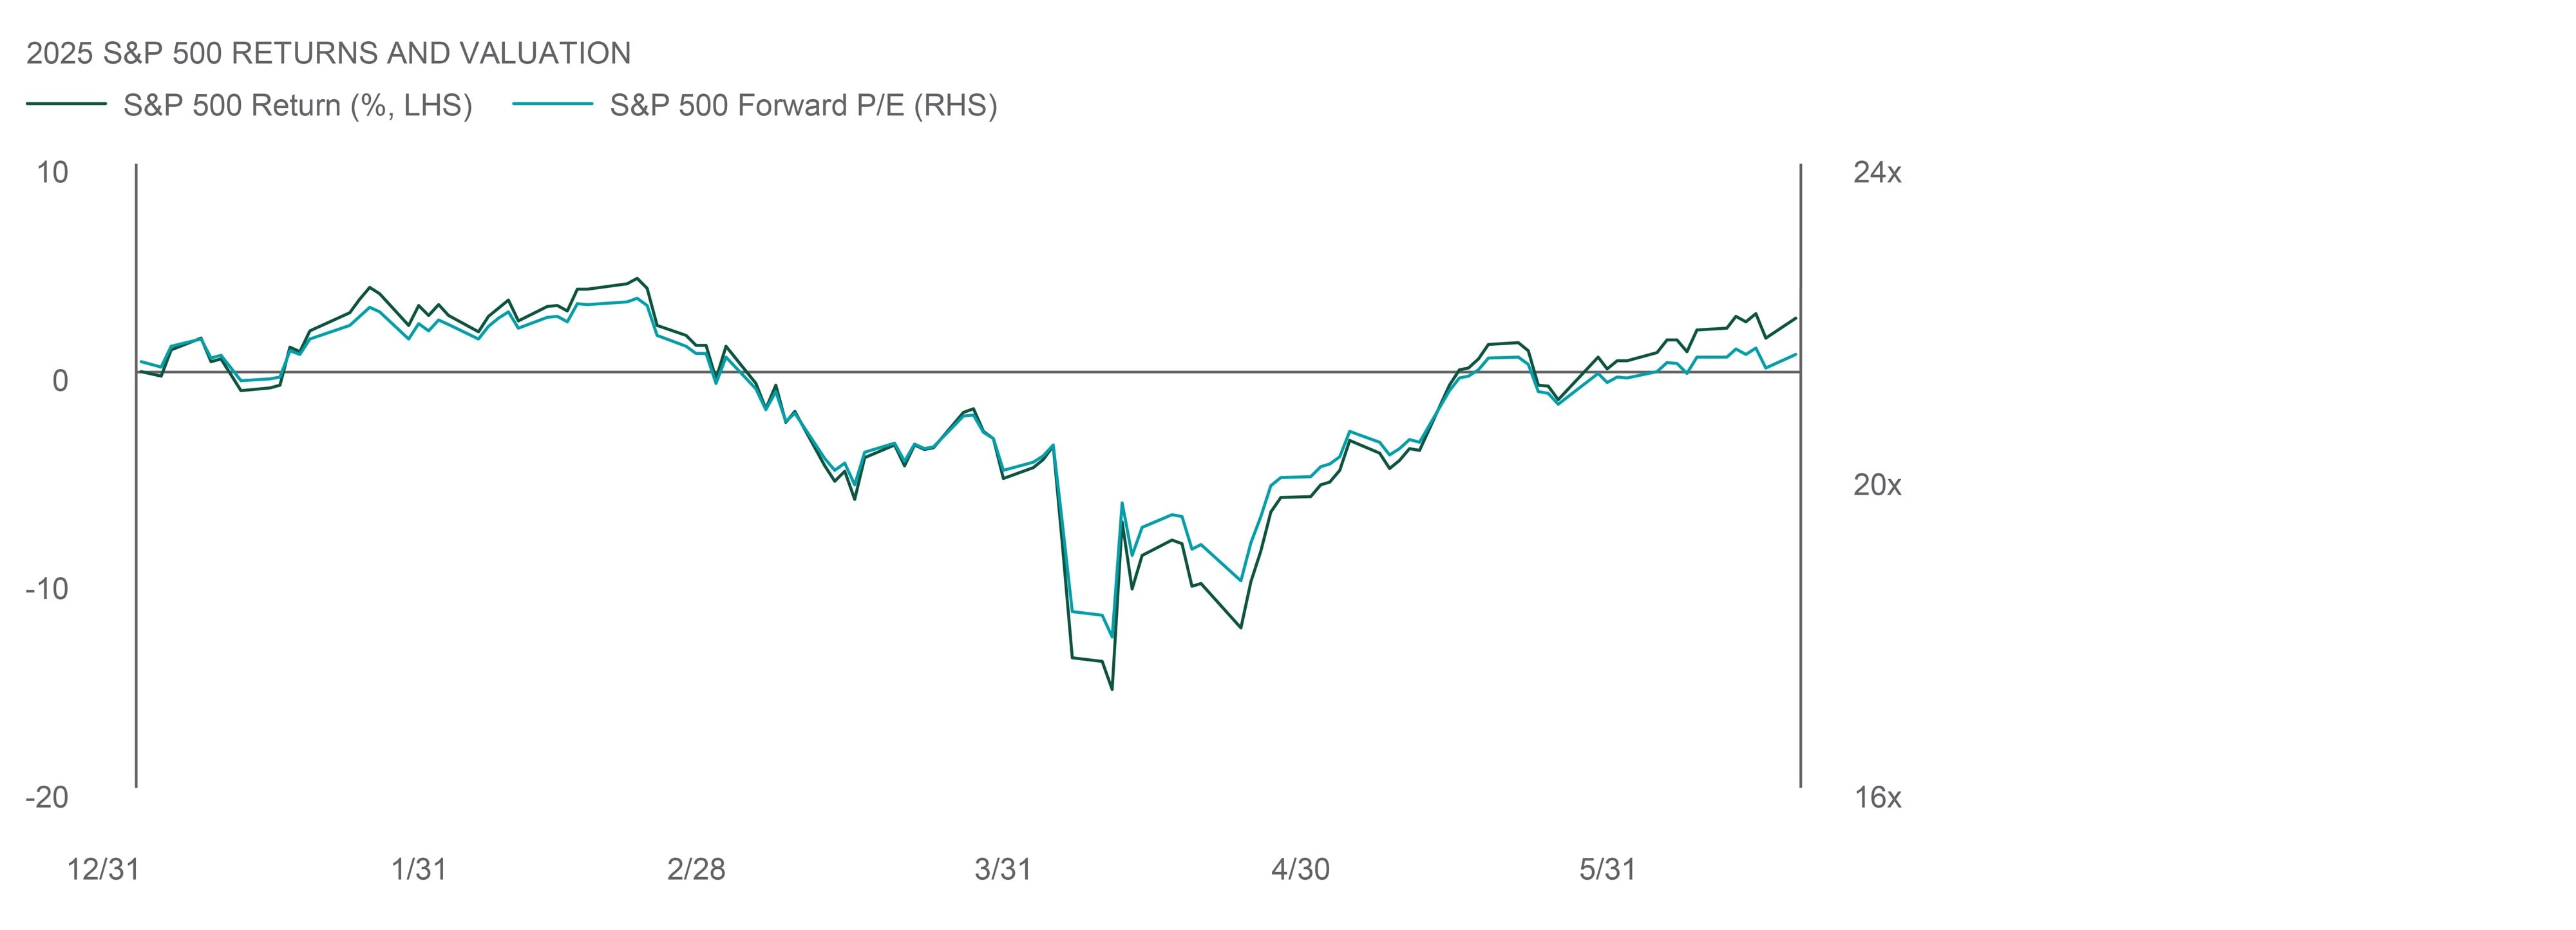
Source: Northern Trust Asset Management, Bloomberg, FactSet. S&P 500 Index. Data is from 12/31/2024 through 6/16/2025. Past performance is not indicative or a guarantee of future results. Index performance returns do not reflect any management fees, transaction costs or expenses. It is not possible to invest directly in any index. Historical trends are not predictive of future results.
- U.S. equities have performed well over the last month with some help from the resurgence in megacap tech.
- The S&P 500 P/E widened back out to a little under 22x, which is above 2024 year-end levels.
- Although the tech rally could continue to support the U.S. market, we do not believe it is a good environment to take a sizable position in either direction.
Real Assets
Listed infrastructure has long been a favored option of global investors due to the sector’s high barriers-to-entry, predictable, inflation-linked cash flows, and equity-like returns with lower volatility. These characteristics have led to premium valuations for the sector, as listed infrastructure historically trades at a 9% premium to global equities on an EV/EBITDA basis.
Starting in 2022, the global risk-free rate began an upward trend driven by central banks need to combat inflationary pressures coming out of the pandemic. Global rates have stayed at these higher levels and this more normalized interest rate environment has pushed infrastructure multiples to the lower end of their historic trading range.
A supportive fundamental outlook for infrastructure has drawn investor interest, especially with the backdrop of higher global power demand driven by data centers, energy independence and security, and onshoring and decarbonization of industrial processes. These growth drivers, along with the sector’s essential service nature and historically low relative valuations make the potential for investment in the sector particularly compelling.
— Jim Hardman, Head of Real Assets, Multi-Manager Solutions
Inexpensive INFRA
Listed infrastructure appears historically mispriced.
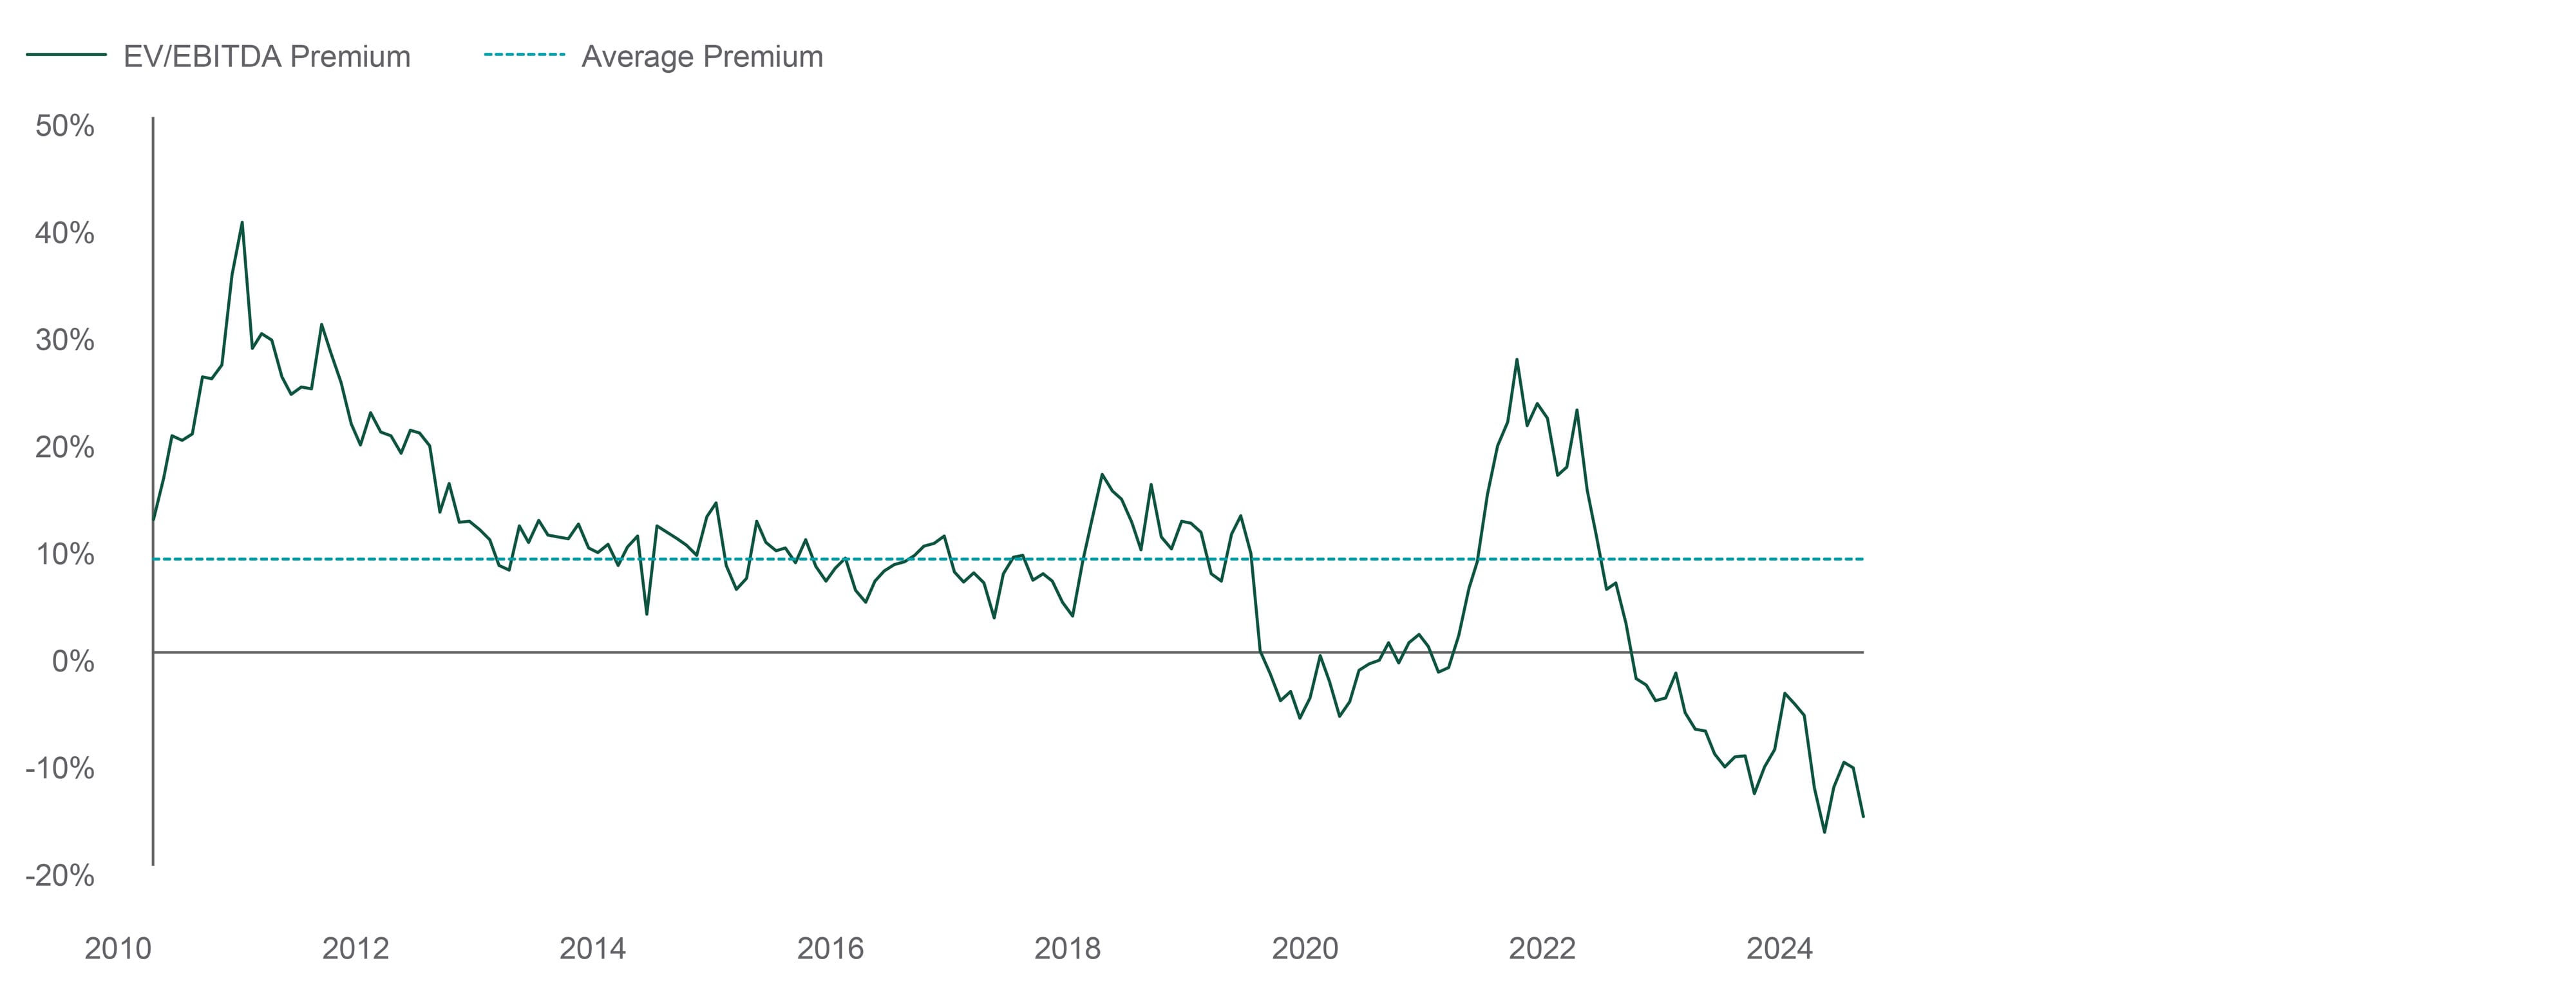
Source: Northern Trust Asset Management, FactSet and Cohen & Steers. Infrastructure represented by the UBS Global 50/50 Infrastructure & Utilities index until 3/31/15 and the FTSE Global Core Infrastructure 50/50 Index thereafter. Spread refers to the relative difference of EV/EBITDA multiples between infrastructure and global equities. Average represents historical average based on monthly data from 12/31/2010 through 5/31/2025. Historical trends are not predictive of future results.
- Infrastructure’s attractive characteristics have driven long-term relative valuation premiums.
- Higher rates have pressured infrastructure valuations lower, creating an opportunity for investors.
- We increased our overweight to infrastructure on resilient cash flows, accelerating fundamentals, and attractive valuations.
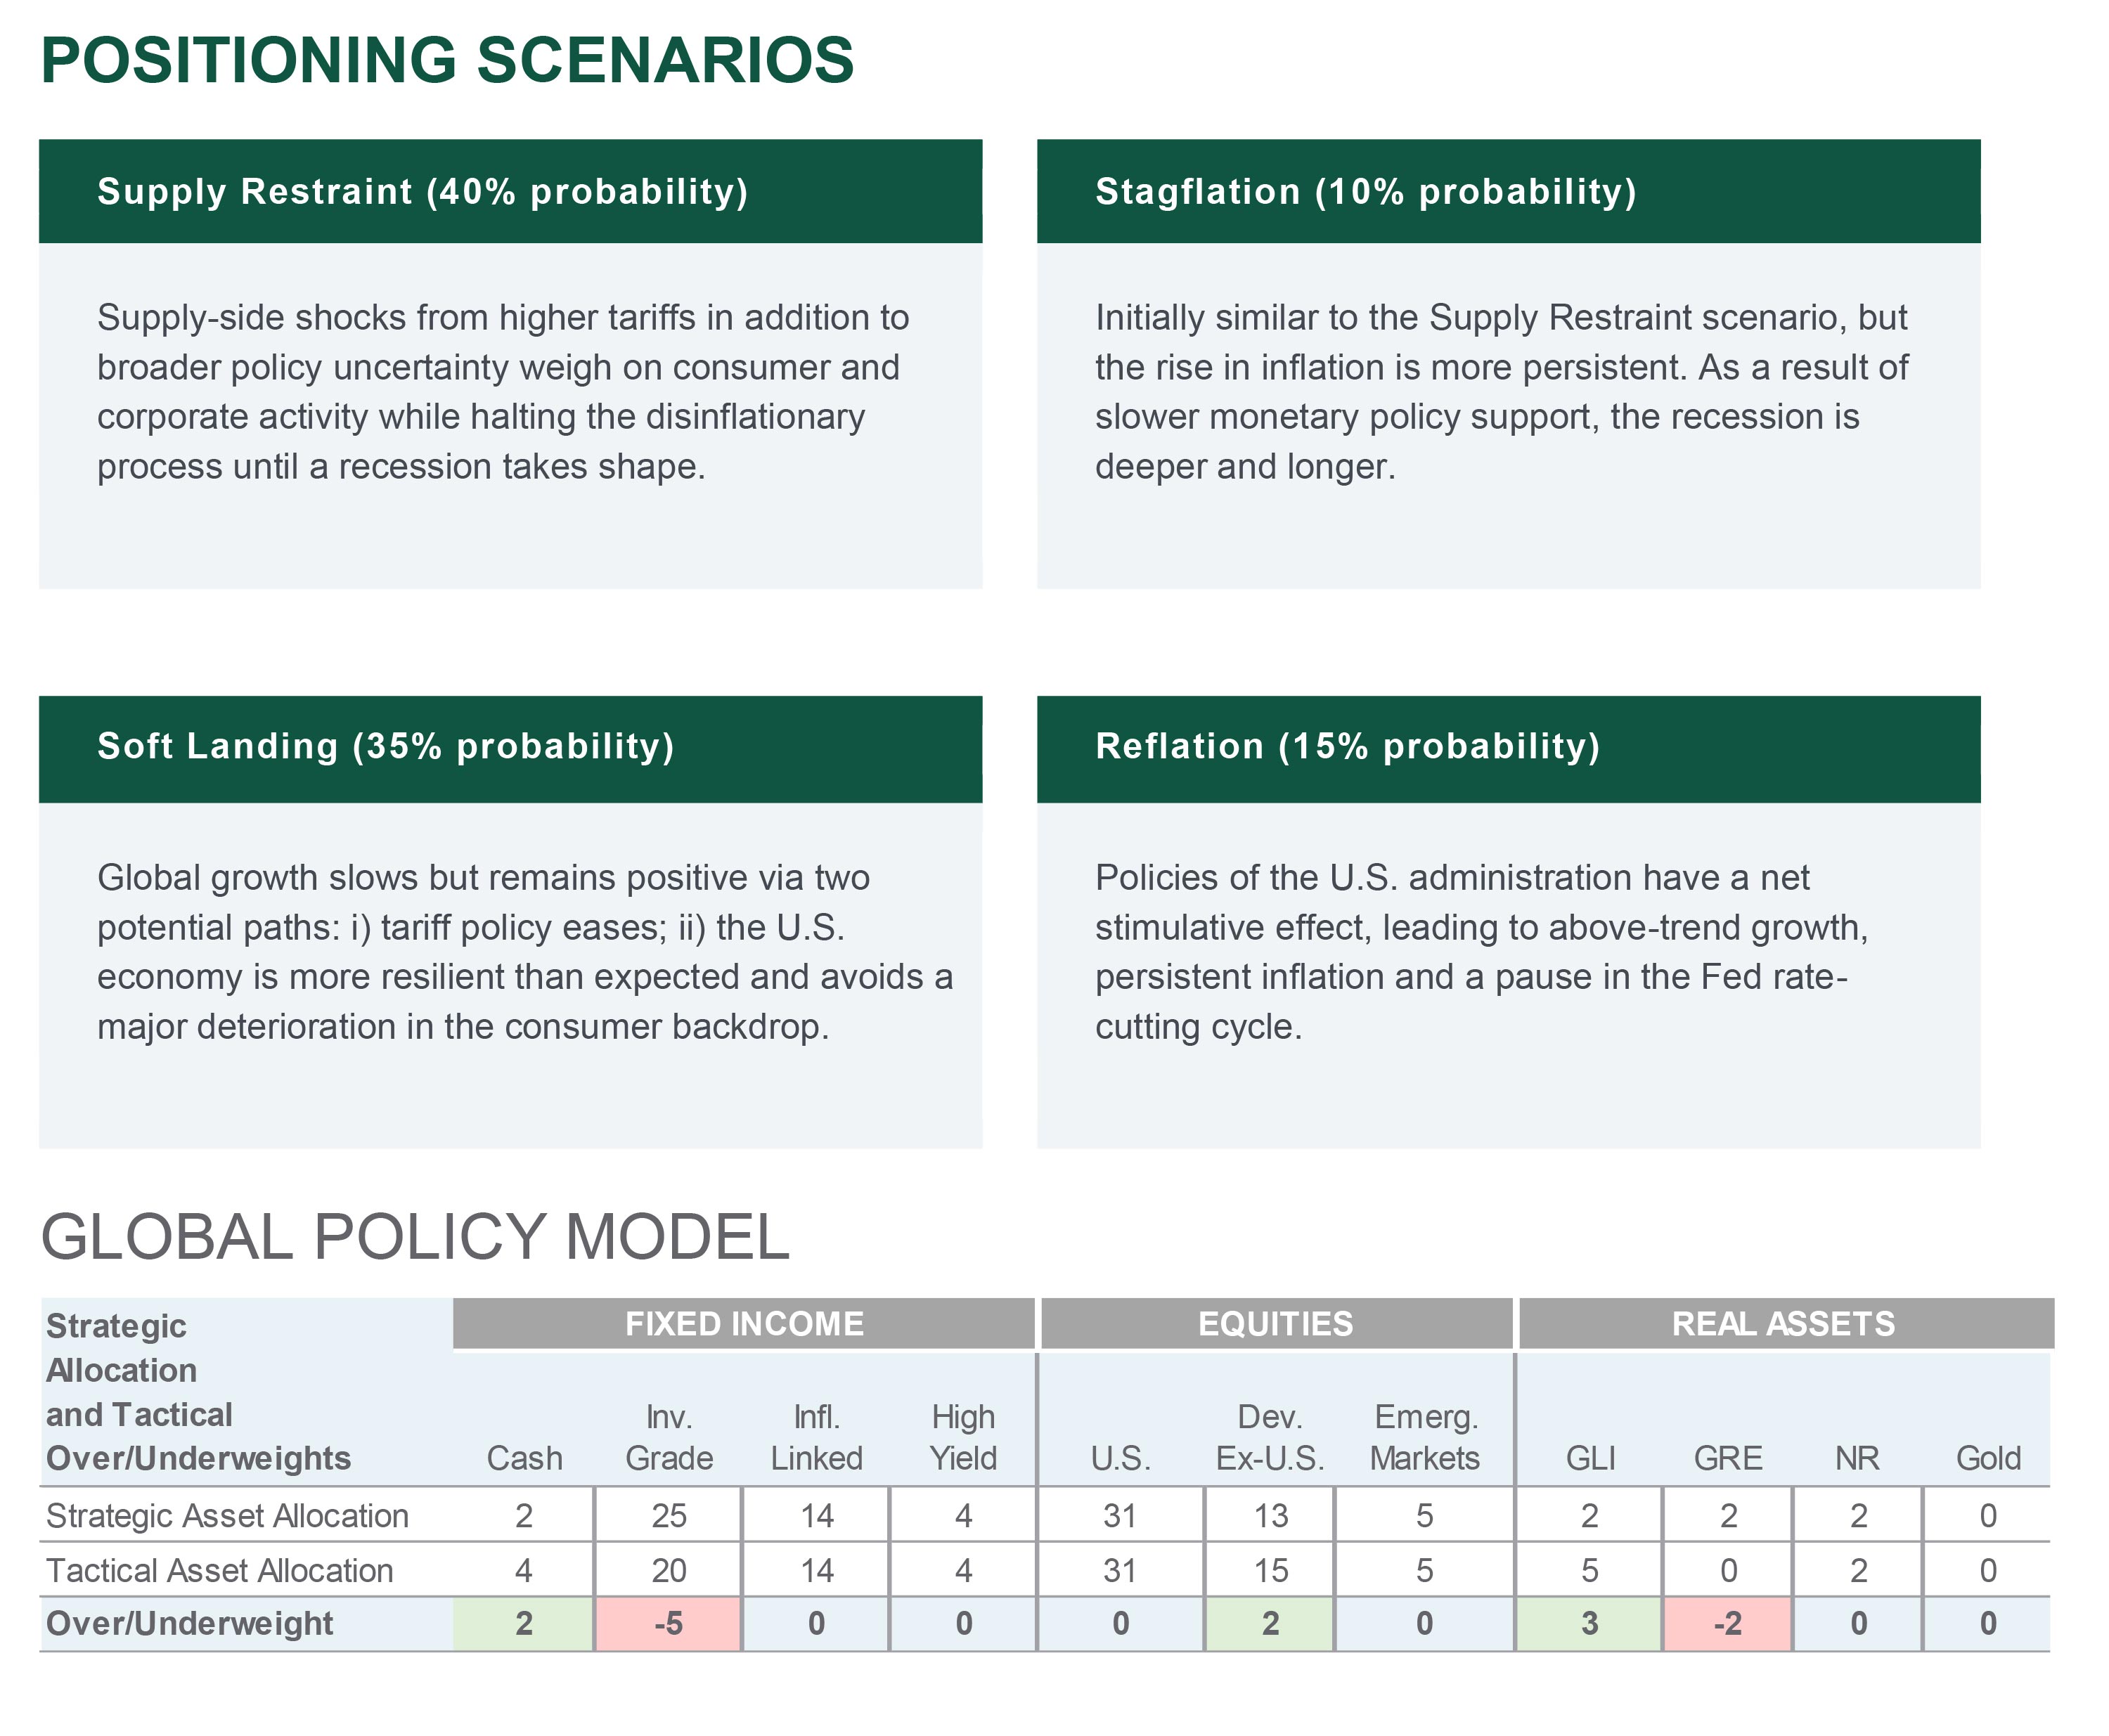
Source: Northern Trust Capital Market Assumptions Working Group, Investment Policy Committee. Strategic allocation is based on capital market return, risk and correlation assumptions developed annually; most recent model released 1/15/2025. The model cannot account for the impact that economic, market and other factors may have on the implementation and ongoing management of an actual investment strategy. Asset allocation does not guarantee a profit or protection against a loss in declining markets. GLI = Global Listed Infrastructure, GRE = Global Real Estate, NR = Natural Resources. Unless otherwise noted, the statements expressed herein are solely opinions of Northern Trust. Northern Trust does not make any representation, assurance, or other promise as to the accuracy, impact, or potential occurrence of any events or outcomes expressed in such opinions.
Unless noted otherwise, data is sourced from Bloomberg as of June 2025.
Main Point
Navigating Growth and Geopolitical Strain
AI-driven growth and resilient credit markets offer support, but geopolitical and fiscal headwinds may complicate the outlook. Investors appear to be positioning with care, favoring quality and global balance.

Contact Us
Interested in learning more about our expertise and how we can help?
EV/EBITDA: EV/EBITDA is the ratio of enterprise value to earnings before interest, taxes, depreciation, and amortization using current fiscal year estimates.
FTSE Global Infrastructure 50/50 Index: The FTSE Global Core Infrastructure 50/50 Index and FTSE Developed Core Infrastructure 50/50 Index give participants an industry-defined interpretation of infrastructure and adjust the exposure to certain infrastructure sub-sectors. The constituent weights for these indices are adjusted as part of the semi-annual review according to three broad industry sectors – 50% Utilities, 30% Transportation including capping of 7.5% for railroads/railways and a 20% mix of other sectors including pipelines, satellites and telecommunication towers. Company weights within each group are adjusted in proportion to their investable market capitalisation.
MSCI AC World IMI: The MSCI ACWI Investable Market Index (IMI) captures large, mid and small cap representation across 23 Developed Markets (DM) and 24 Emerging Markets (EM) countries. With 8,640 constituents, the index is comprehensive, covering approximately 99% of the global equity investment opportunity set.
S&P 500 Index: The index, a gauge of the large-cap U.S. equity market, includes 500 companies that represent approximately 80% of the market capitalization of publicly traded U.S. equities.
UBS Global 50/50 Infrastructure & Utilities Index: The UBS 50/50 Infrastructure & Utilities Index tracks a 50% exposure to the global developed-market infrastructure and a 50% exposure to the global developed-market utilities sector.
MSCI USA IMI: The MSCI USA Investable Market Index (IMI) is designed to measure the performance of the large, mid and small cap segments of the U.S. market. With 2,319 constituents, the index covers approximately 99% of the free float-adjusted market capitalization in the U.S.
IMPORTANT INFORMATION
The information contained herein is intended for use with current or prospective clients of Northern Trust Investments, Inc (NTI) or its affiliates. The information is not intended for distribution or use by any person in any jurisdiction where such distribution would be contrary to local law or regulation. Northern Trust Asset Management’s (NTAM) and its affiliates may have positions in and may effect transactions in the markets, contracts and related investments different than described in this information. This information is obtained from sources believed to be reliable, its accuracy and completeness are not guaranteed, and is subject to change. Information does not constitute a recommendation of any investment strategy, is not intended as investment advice and does not take into account all the circumstances of each investor.
This information is provided for informational purposes only and is not intended to be, and should not be construed as, an offer, solicitation or recommendation with respect to any transaction and should not be treated as legal advice, investment advice or tax advice. Recipients should not rely upon this information as a substitute for obtaining specific legal or tax advice from their own professional legal or tax advisors. References to specific securities and their issuers are for illustrative purposes only and are not intended and should not be interpreted as recommendations to purchase or sell such securities. Indices and trademarks are the property of their respective owners. Information is subject to change based on market or other conditions.
All securities investing and trading activities risk the loss of capital. Each portfolio is subject to substantial risks including market risks, strategy risks, advisor risk, and risks with respect to its investment in other structures. There can be no assurance that any portfolio investment objectives will be achieved, or that any investment will achieve profits or avoid incurring substantial losses. No investment strategy or risk management technique can guarantee returns or eliminate risk in any market environment. Risk controls and models do not promise any level of performance or guarantee against loss of principal. Any discussion of risk management is intended to describe NTAM’s efforts to monitor and manage risk but does not imply low risk.
Past performance is not a guarantee of future results. Performance returns and the principal value of an investment will fluctuate. Performance returns contained herein are subject to revision by NTAM. Comparative indices shown are provided as an indication of the performance of a particular segment of the capital markets and/or alternative strategies in general. Index performance returns do not reflect any management fees, transaction costs or expenses. It is not possible to invest directly in any index. Net performance returns are reduced by investment management fees and other expenses relating to the management of the account. Gross performance returns contained herein include reinvestment of dividends and other earnings, transaction costs, and all fees and expenses other than investment management fees, unless indicated otherwise. For U.S. NTI prospects or clients, please refer to Part 2a of the Form ADV or consult an NTI representative for additional information on fees.
Forward-looking statements and assumptions are NTAM’s current estimates or expectations of future events or future results based upon proprietary research and should not be construed as an estimate or promise of results that a portfolio may achieve. Actual results could differ materially from the results indicated by this information. Historical trends are not predictive of future results.
Northern Trust Asset Management is composed of Northern Trust Investments, Inc., Northern Trust Global Investments Limited, Northern Trust Fund Managers (Ireland) Limited, Northern Trust Global Investments Japan, K.K., NT Global Advisors, Inc., 50 South Capital Advisors, LLC, Northern Trust Asset Management Australia Pty Ltd, and investment personnel of The Northern Trust Company of Hong Kong Limited and The Northern Trust Company.
Not FDIC insured | May lose value | No bank guarantee