- Who We Serve
- What We Do
- About Us
- Insights & Research
- Who We Serve
- What We Do
- About Us
- Insights & Research
Tariff U-Turn; Lingering Doubts
Markets rallied after a surprise tariff rollback, but with valuations stretched and policy signals still mixed, investors appear to be leaning toward flexibility, fundamentals, and selective exposure.
- Portfolio Construction
- Fixed Income Insights
- High Yield Strategy
- Risk Management
Key Points
What it is
A sudden shift in U.S. trade policy sparked a market bounce, and a moment of reflection for investors.
Why it matters
The pause in trade tensions may offer breathing room, but it doesn’t eliminate the risks tied to valuation and policy shifts.
Where it's going
Markets may remain reactive, making flexibility and a focus on fundamentals increasingly important.
The financial landscape is in a state of flux. Not long ago, the announcement of large tariffs sent shockwaves through global markets. As the aftershocks rippled out, policymakers scrambled to craft responses, only to eventually backtrack on their initial moves in a bid to curb unintended consequences. The latest example is the large reduction in the reciprocal tariff rates that effectively brought trade between the U.S. and China to a halt.
Similar to trade deals announced with other nations, we are witnessing the emergence of a "90-day pause." This is not just a pause; it’s a strategic time-out where markets, governments, and investors are stepping back to reassess the broader implications created by the last few weeks of intense policy uncertainty. Amid this pause, investors are digesting economic data, rethinking long-held strategies, and attempting to chart a new course in an environment where quick tactical moves have proven risky.
A pivotal point in current market sentiment revolves around assets tied to U.S. growth. Over the past years, these assets—encompassing high-flying equity sectors like technology and consumer discretionary, as well as credit markets and the U.S. dollar—have significantly outperformed. However, despite their promise of superior growth, they are relatively expensive by many fundamental metrics. In times of market stress, these overvaluations have shown that such assets do not offer the cushion of safety that investors might expect. The lofty valuations of U.S. growth assets, built on future potential rather than current stability, mean that during a downturn, they tend to falter rather than act as a safety net. This reality is prompting both institutional and individual investors to re-examine allocation strategies in search of true defensive assets that can withstand turbulent periods.
Complicating the picture further is the difficulty in interpreting fresh economic data. The mix of conflicting signals—whether from trade imbalances, sharp falls in consumer and business confidence, or fluctuating currency values—adds layers of uncertainty. In this context, the 90-day pause is being seen as an opportunity to take a hard look at these mixed messages before making any decisive moves.
An undercurrent of optimism permeates financial markets. Even amid the caution, some investors are betting that these pauses will set the stage for a robust rebound. As we navigate choppy waters, this phase of waiting invites us to reflect on the balance between risk and reward. It’s a reminder that markets are cyclical, and sometimes the smartest move is to pause, analyze, and then pivot.
While the glow of U.S. growth remains alluring, investors are reminded that such assets, when priced too high, may not provide the shield they once did in volatile times. By carefully weighing both the promise and the peril, market participants can craft strategies that endure beyond the current uncertainty. Hence, we are proponents of a more diversified and valuation-sensitive investment approach, and this perspective makes us less enthusiastic about adding growth-sensitive exposure in U.S. assets after the recent rebound in markets.
— Peter Wilke, CFA – Head of Tactical Asset Allocation, Global Asset Allocation
STOCKS BOUNCED BACK, BUT MACRO PROJECTIONS DID NOT
Despite increased inflation and decreased growth expectations, U.S. stocks have retraced losses.
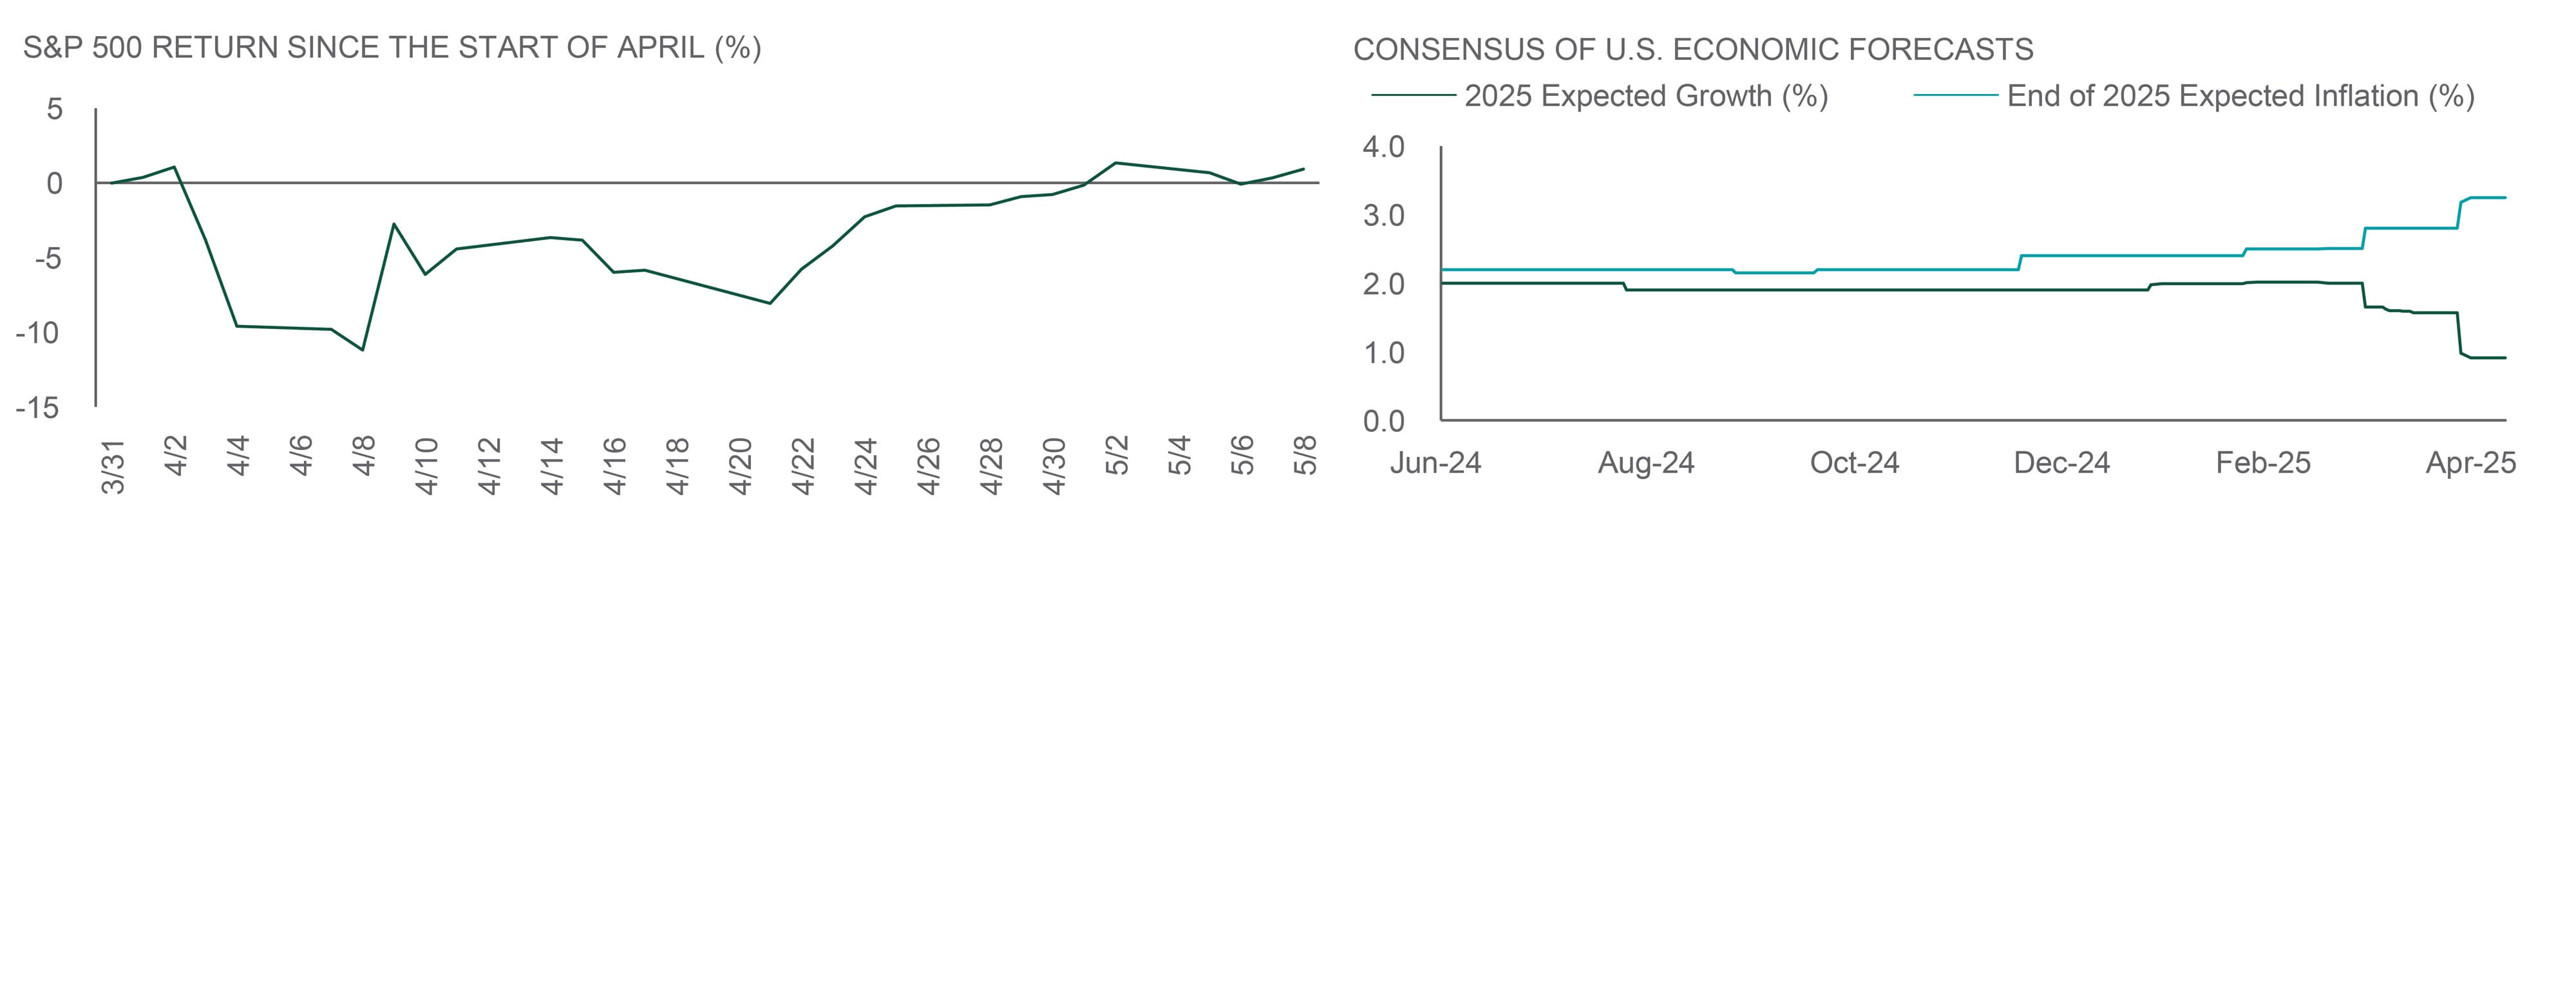
Source: Northern Trust Asset Management, Bloomberg. Left panel: data from 3/31/2025 to 5/8/2025. Right panel: data from 6/30/2024 to 5/8/2025. Expected growth is the percent change from the same quarter in the prior year (fourth quarter); expected inflation is average level of the year-over-year change in core Personal Consumption Expenditures inflation across the last three months of 2025.
Interest Rates
We took the main message from the May FOMC meeting to be that, while uncertainty around the near-term path for the economy has increased further – as have the risks to both sides of the Fed’s dual mandate – the Committee views its monetary policy well positioned to wait for further clarity on the direction of the economy. Overall, the Chair’s press conference conveyed a message that the Committee believes that, “the current stance of monetary policy leaves them well positioned to respond in a timely way to potential economic developments”. The Chair went on to repeatedly emphasize that, “We [the FOMC] don’t think we need to be in a hurry. We think we can be patient.”
Markets have been volatile since the March FOMC meeting, especially in early April. Fed Funds Futures at one point implied 25-basis-point (bp) cuts at both the June and July FOMC meetings, which we viewed as overly aggressive. Yields on U.S. Treasuries were little changed on May 7th following the FOMC statement and the Chair’s press conference, while equity markets trimmed earlier intraday gains. The futures-implied number of further rate cuts over the next twelve months remained at four 25-bp cuts – a bit more aggressive than our view.
— Dan LaRocco, Head of U.S. Liquidity, Global Fixed Income
INCREASED RISKS ACROSS THE DUAL MANDATE
Uncertainty and risks have increased, but the Fed views its monetary policy well positioned to hold pat.
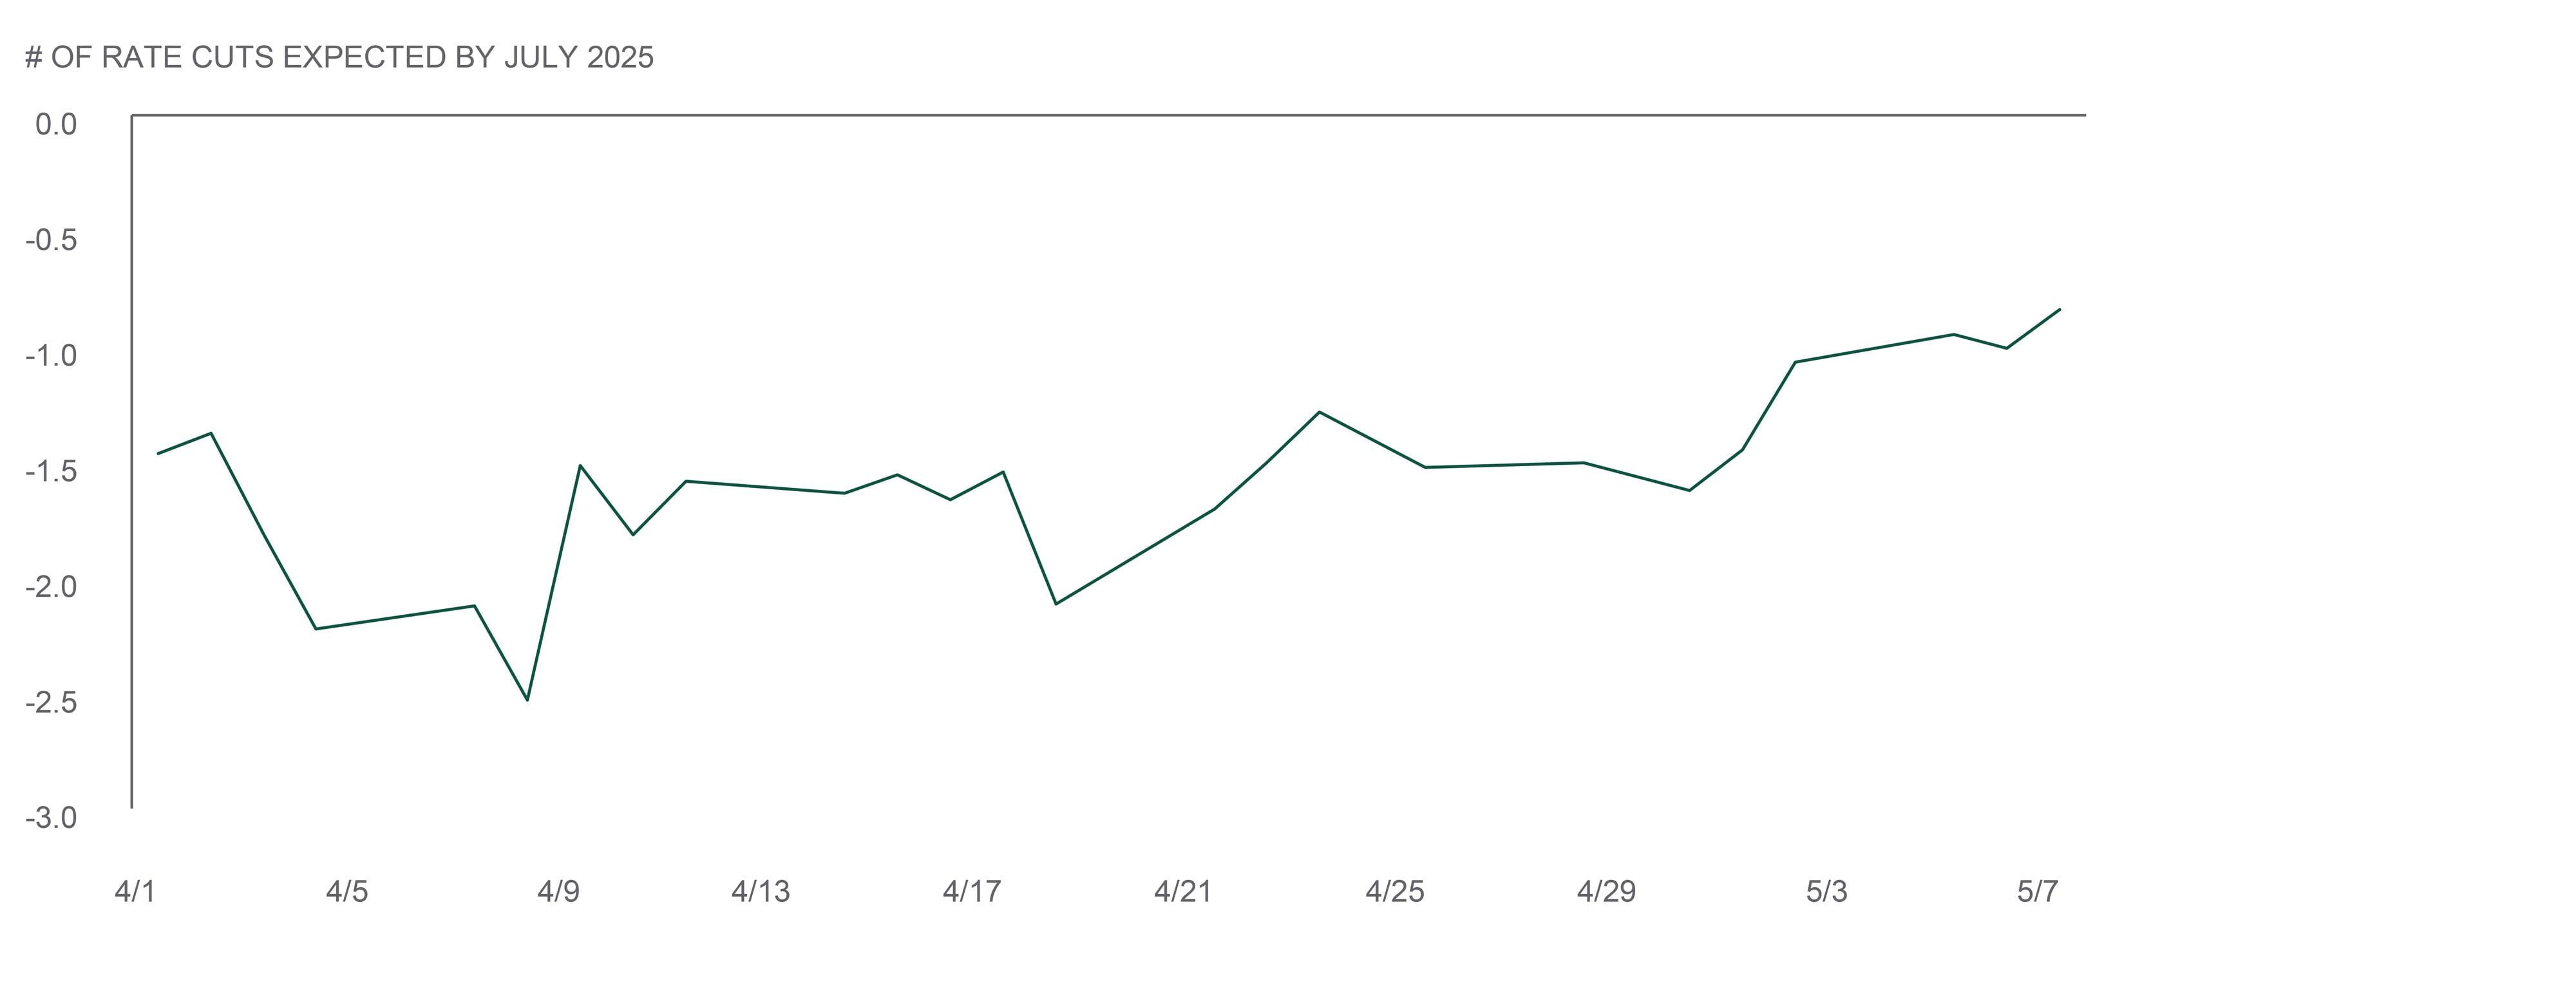
Source: Northern Trust Asset Management, Bloomberg. Market expectations implied by futures. Data from 4/1/2025 to 5/7/2025. Historical trends are not predictive of future results.
- The FOMC left policy unchanged in May, as widely expected.
- While risks have increased on both sides of the dual mandate, the FOMC does not think it needs to be in a hurry.
- While uncertainty has undoubtedly remained elevated, we view current rates as not too far off fair value and are therefore neutral duration across the fixed income portfolios we manage.
Credit Markets
The market saw a historic increase in volatility during the month with the unveiling of potential reciprocal tariffs in early April and accompanying recession fears. The CBOE VIX Index reached a high of 52 on April 8, its highest closing reading since the COVID crisis in March 2020, before falling in subsequent weeks as daily news flow indicated a potential de-escalation of trade tensions. Credit markets showed remarkable resilience during this period of pronounced volatility. High yield spreads gapped higher to levels not seen since 2023 before eventually retracing, with returns ending the month flat, supported by the help of a rates tailwind. In line with the increase in volatility, sector dispersion increased materially in April as well.
Despite elevated trade tensions, U.S. high yield is relatively insulated with a majority of revenues coming from North America. Approximately 78% of revenues among U.S. high yield issuers is generated in North America. With the notable increase in uncertainty and dispersion, this creates opportunity for active management to position for these possible tariff scenarios.
—Ben McCubbin, Co-Head of High Yield, Global Fixed Income
—Sau Mui, Co-Head of High Yield, Global Fixed Income
HIGH YIELD REVENUES BY INDUSTRY
U.S. high yield is relatively insulated from trade tensions as a majority of revenues come from North America.
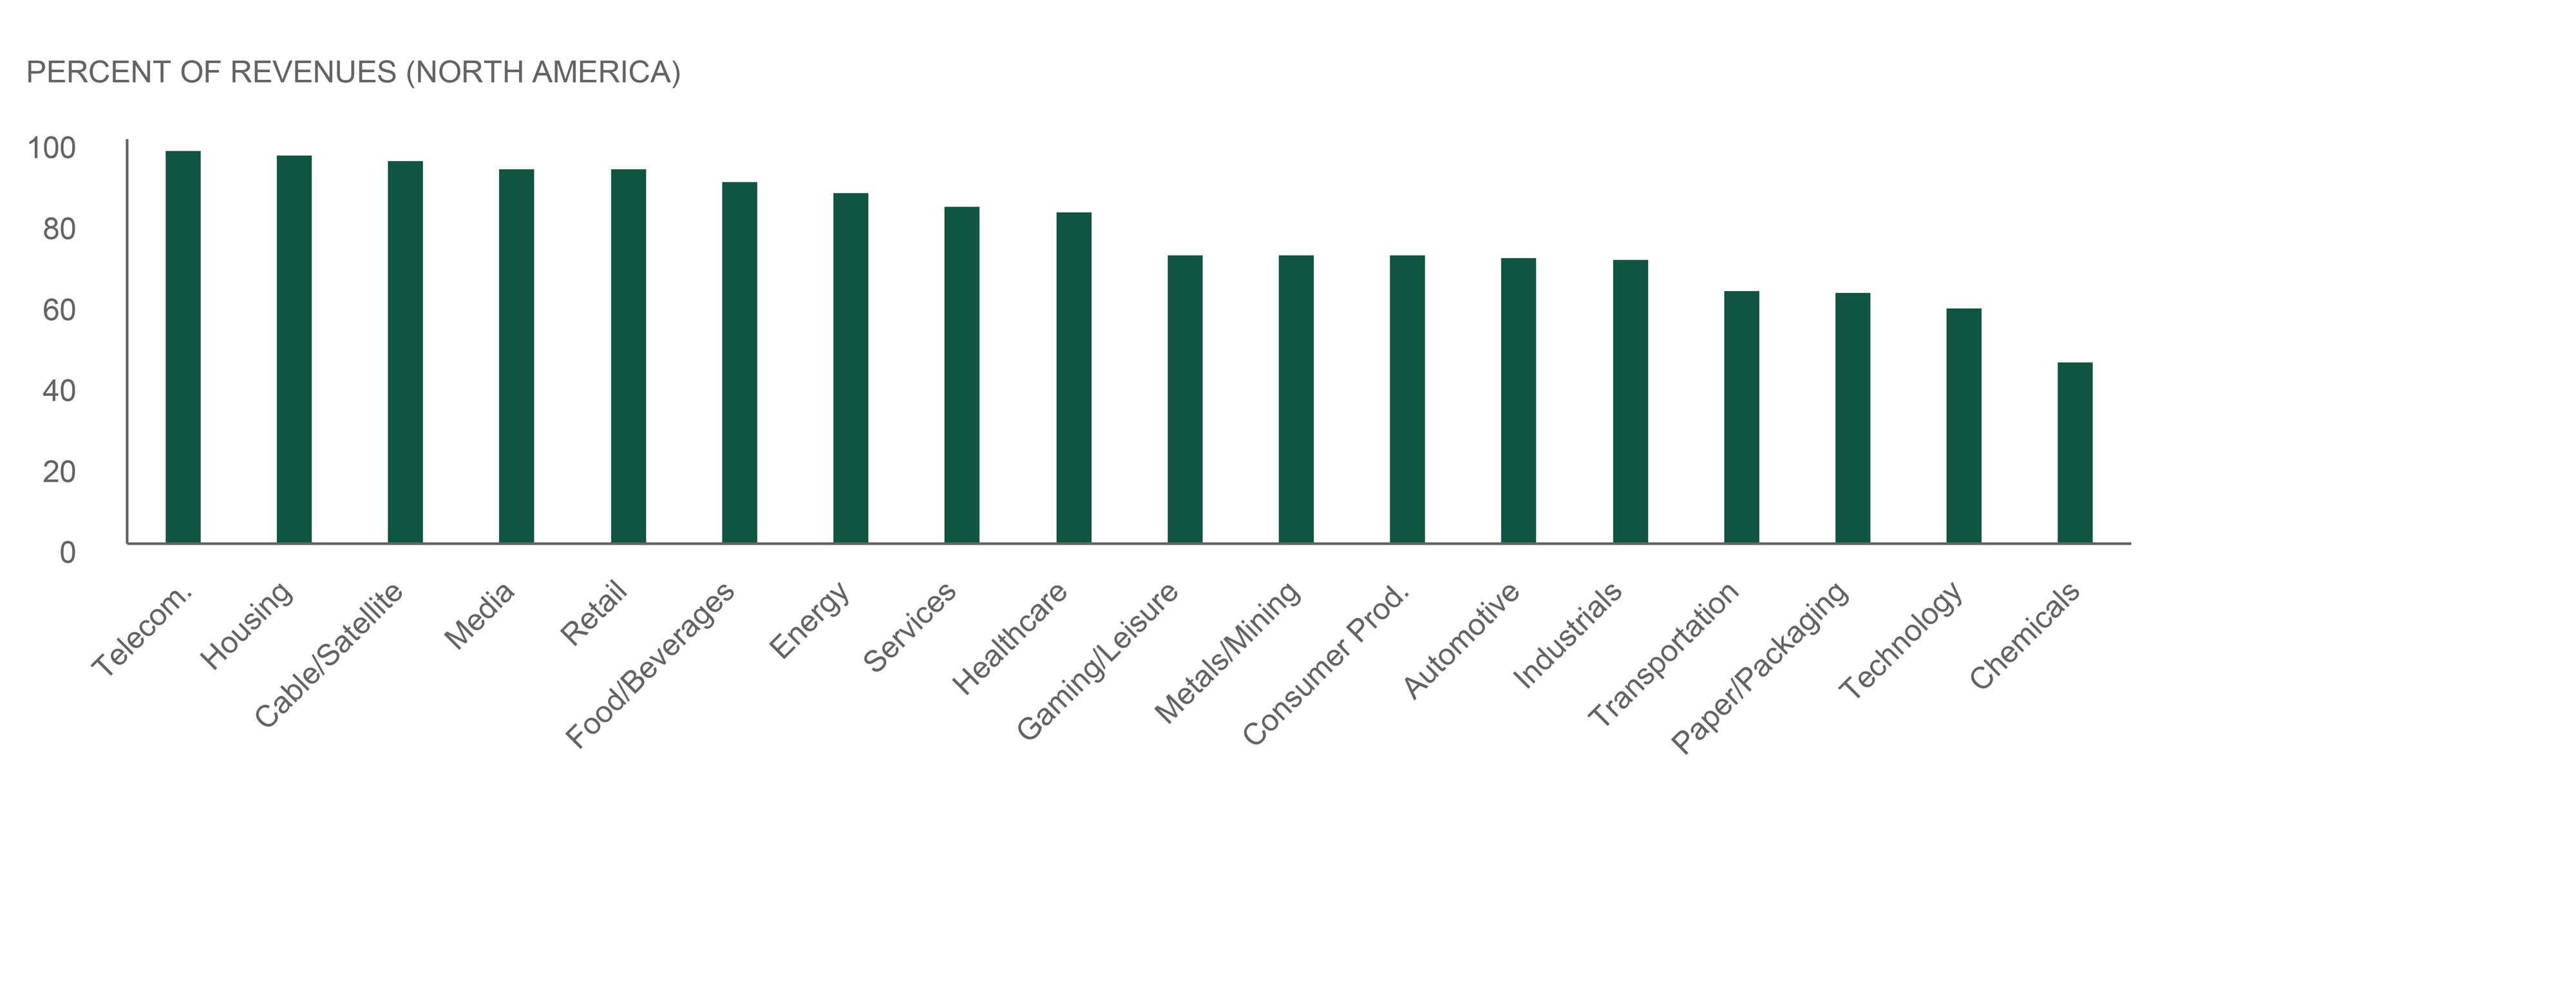
Source: Northern Trust Asset Management, J.P. Morgan. Data as of 4/17/2025. Historical trends are not predictive of future results.
- In line with the increase in volatility, sector dispersion increased materially in April.
- High yield revenues for U.S. issuers is approximately 78% generated in North America vs. 22% international.
- Within high yield, sectors with the highest percentage of revenues generated in North America are Telecom, Housing, and Cable/Satellite, and sectors with the lowest being Paper/Packaging, Technology, and Chemicals.
Equities
The steep drawdown following the April 2nd “Liberation Day” tariffs proved short lived. On April 9th President Trump announced a 90-day pause that sent U.S. large caps soaring nearly 10%, with an additional 10.4% gained during a 9-session win streak from April 21st through May 2nd. Information Technology and technology-adjacent stocks were the best performers. Energy was a notable laggard with a weakening global outlook and OPEC+ announcing a supply increase. Health Care also lagged on tariff concerns. Outside the U.S., markets followed a similar return shape. U.S. investors in overseas markets benefited significantly from dollar weakness.
With over 80% of U.S. large caps reporting, Q1 2025 earnings have surprised to the upside and posted a robust 13.3% growth vs. Q1 2024. Looking forward, estimates for the rest of the year have come in substantially since the start of the year and may continue trending down. Following the recent rally and with building U.S. growth headwinds, we decided to pull our 2% overweight to U.S. Equities. Although there are positive potential catalysts, such as trade progress, deregulation, and potential tax deal, the risks are skewed to the downside.
— Jordan Dekhayser, Head of Equity Client Portfolio Management
EASY GO, EASY COME
Volatility has waxed and waned.
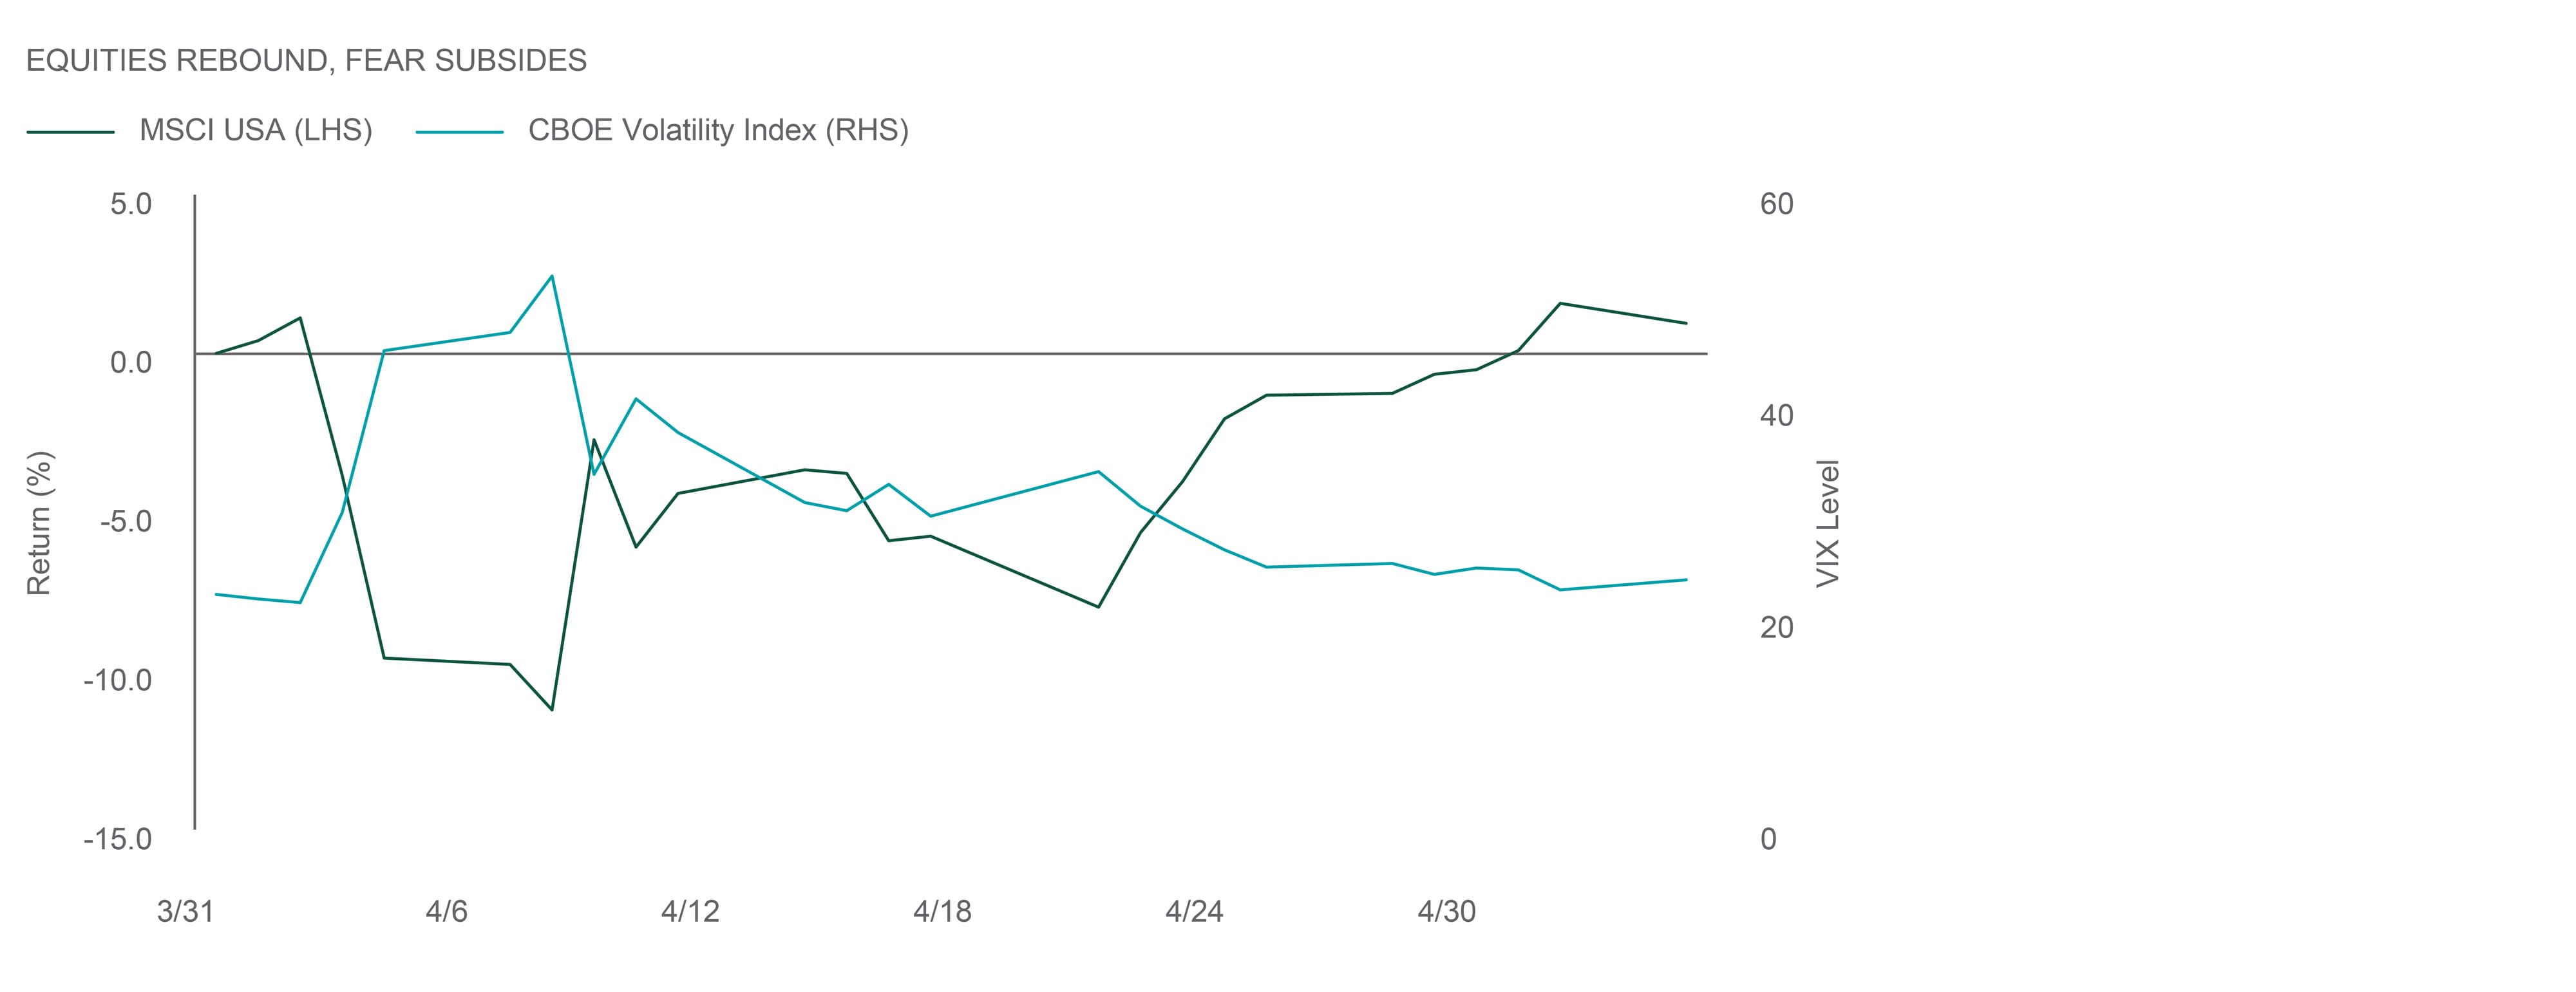
Source: Northern Trust Asset Management, MSCI, CBOE. Data is from 3/31/2025 through 5/6/2025. Past performance is not indicative or a guarantee of future results. Index performance returns do not reflect any management fees, transaction costs or expenses. It is not possible to invest directly in any index.
- A historic sell-off and recovery saw its inverted reflection in the Volatility Index (VIX).
- Earnings growth has been robust in Q1 but is expected to come down for the rest of the year.
- We reduced equity exposure based on a holistic assessment of a number of variables that pointed to risk being skewed to the downside.
Real Assets
The European regulated utilities sector, a substantial exposure in the Global Listed Infrastructure space, is often an unexciting subsector with steady cash flows and moderate growth. But in the current environment, a robust earnings growth profile, transparent cash flows and relatively attractive valuations are creating significant interest in the sector.
The European utilities space is comprised of regulated infrastructure monopolies providing electricity, gas, and water services. The sector is typically associated with stable earnings and attractive yields, but policy-driven demand for infrastructure spending has led to the acceleration of the growth prospects for these companies. The U.K. and Western Europe governments are expanding utility networks to bring power into population centers prioritizing energy security, independence and resiliency. Consensus forecasts now project European utilities sector earnings growth of 9.9% per year through 2029, more than double the growth rate of the last 10 years. This growth, coupled with the monopolistic and essential service nature of utilities, makes the potential for investment in the sector particularly compelling.
— Jim Hardman, Head of Real Assets, Multi-Manager Solutions
EUROPEAN ELEVATION
The European utilities sector is poised for accelerating earnings growth.
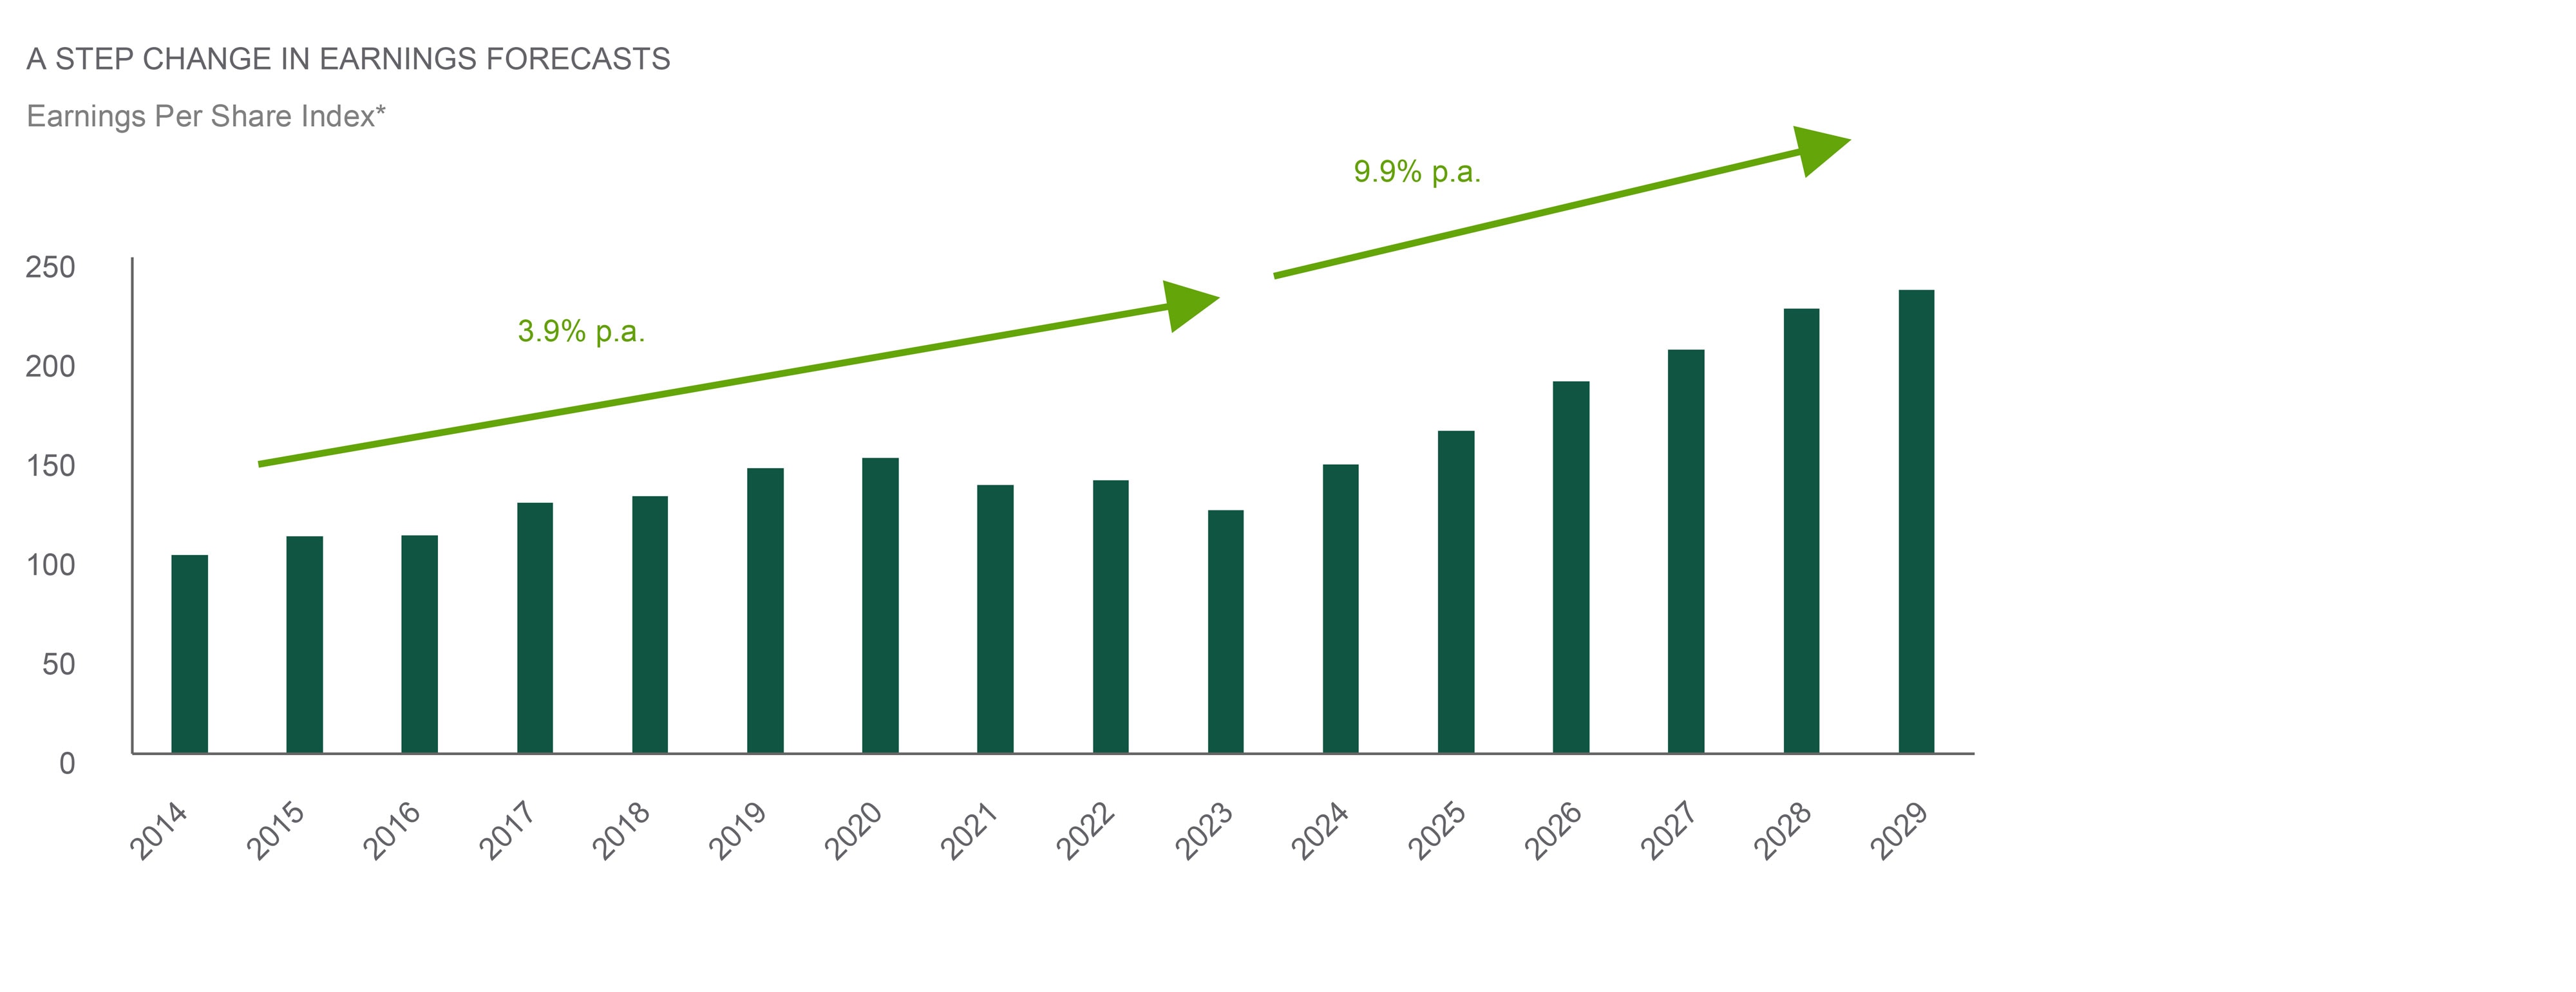
Source: Northern Trust Asset Management, Lazard, FactSet consensus estimates. *EPS is based on an equal-weighted index of 8 Italian- and U.K.-regulated utilities companies indexed to 2014. Historical data from 12/31/2013 through 2/28/2025. Estimates from 2/28/2025 through 12/31/2029. p.a. = per annum. Historical trends are not predictive of future results.
- European regulated earnings growth is accelerating to more than double the growth rate of the last decade.
- Driven by the need for energy security and independence, tailwinds from power demand are accelerating earnings.
- We are now slightly overweight infrastructure on resilient cash flows, accelerating fundamentals, and attractive valuations.
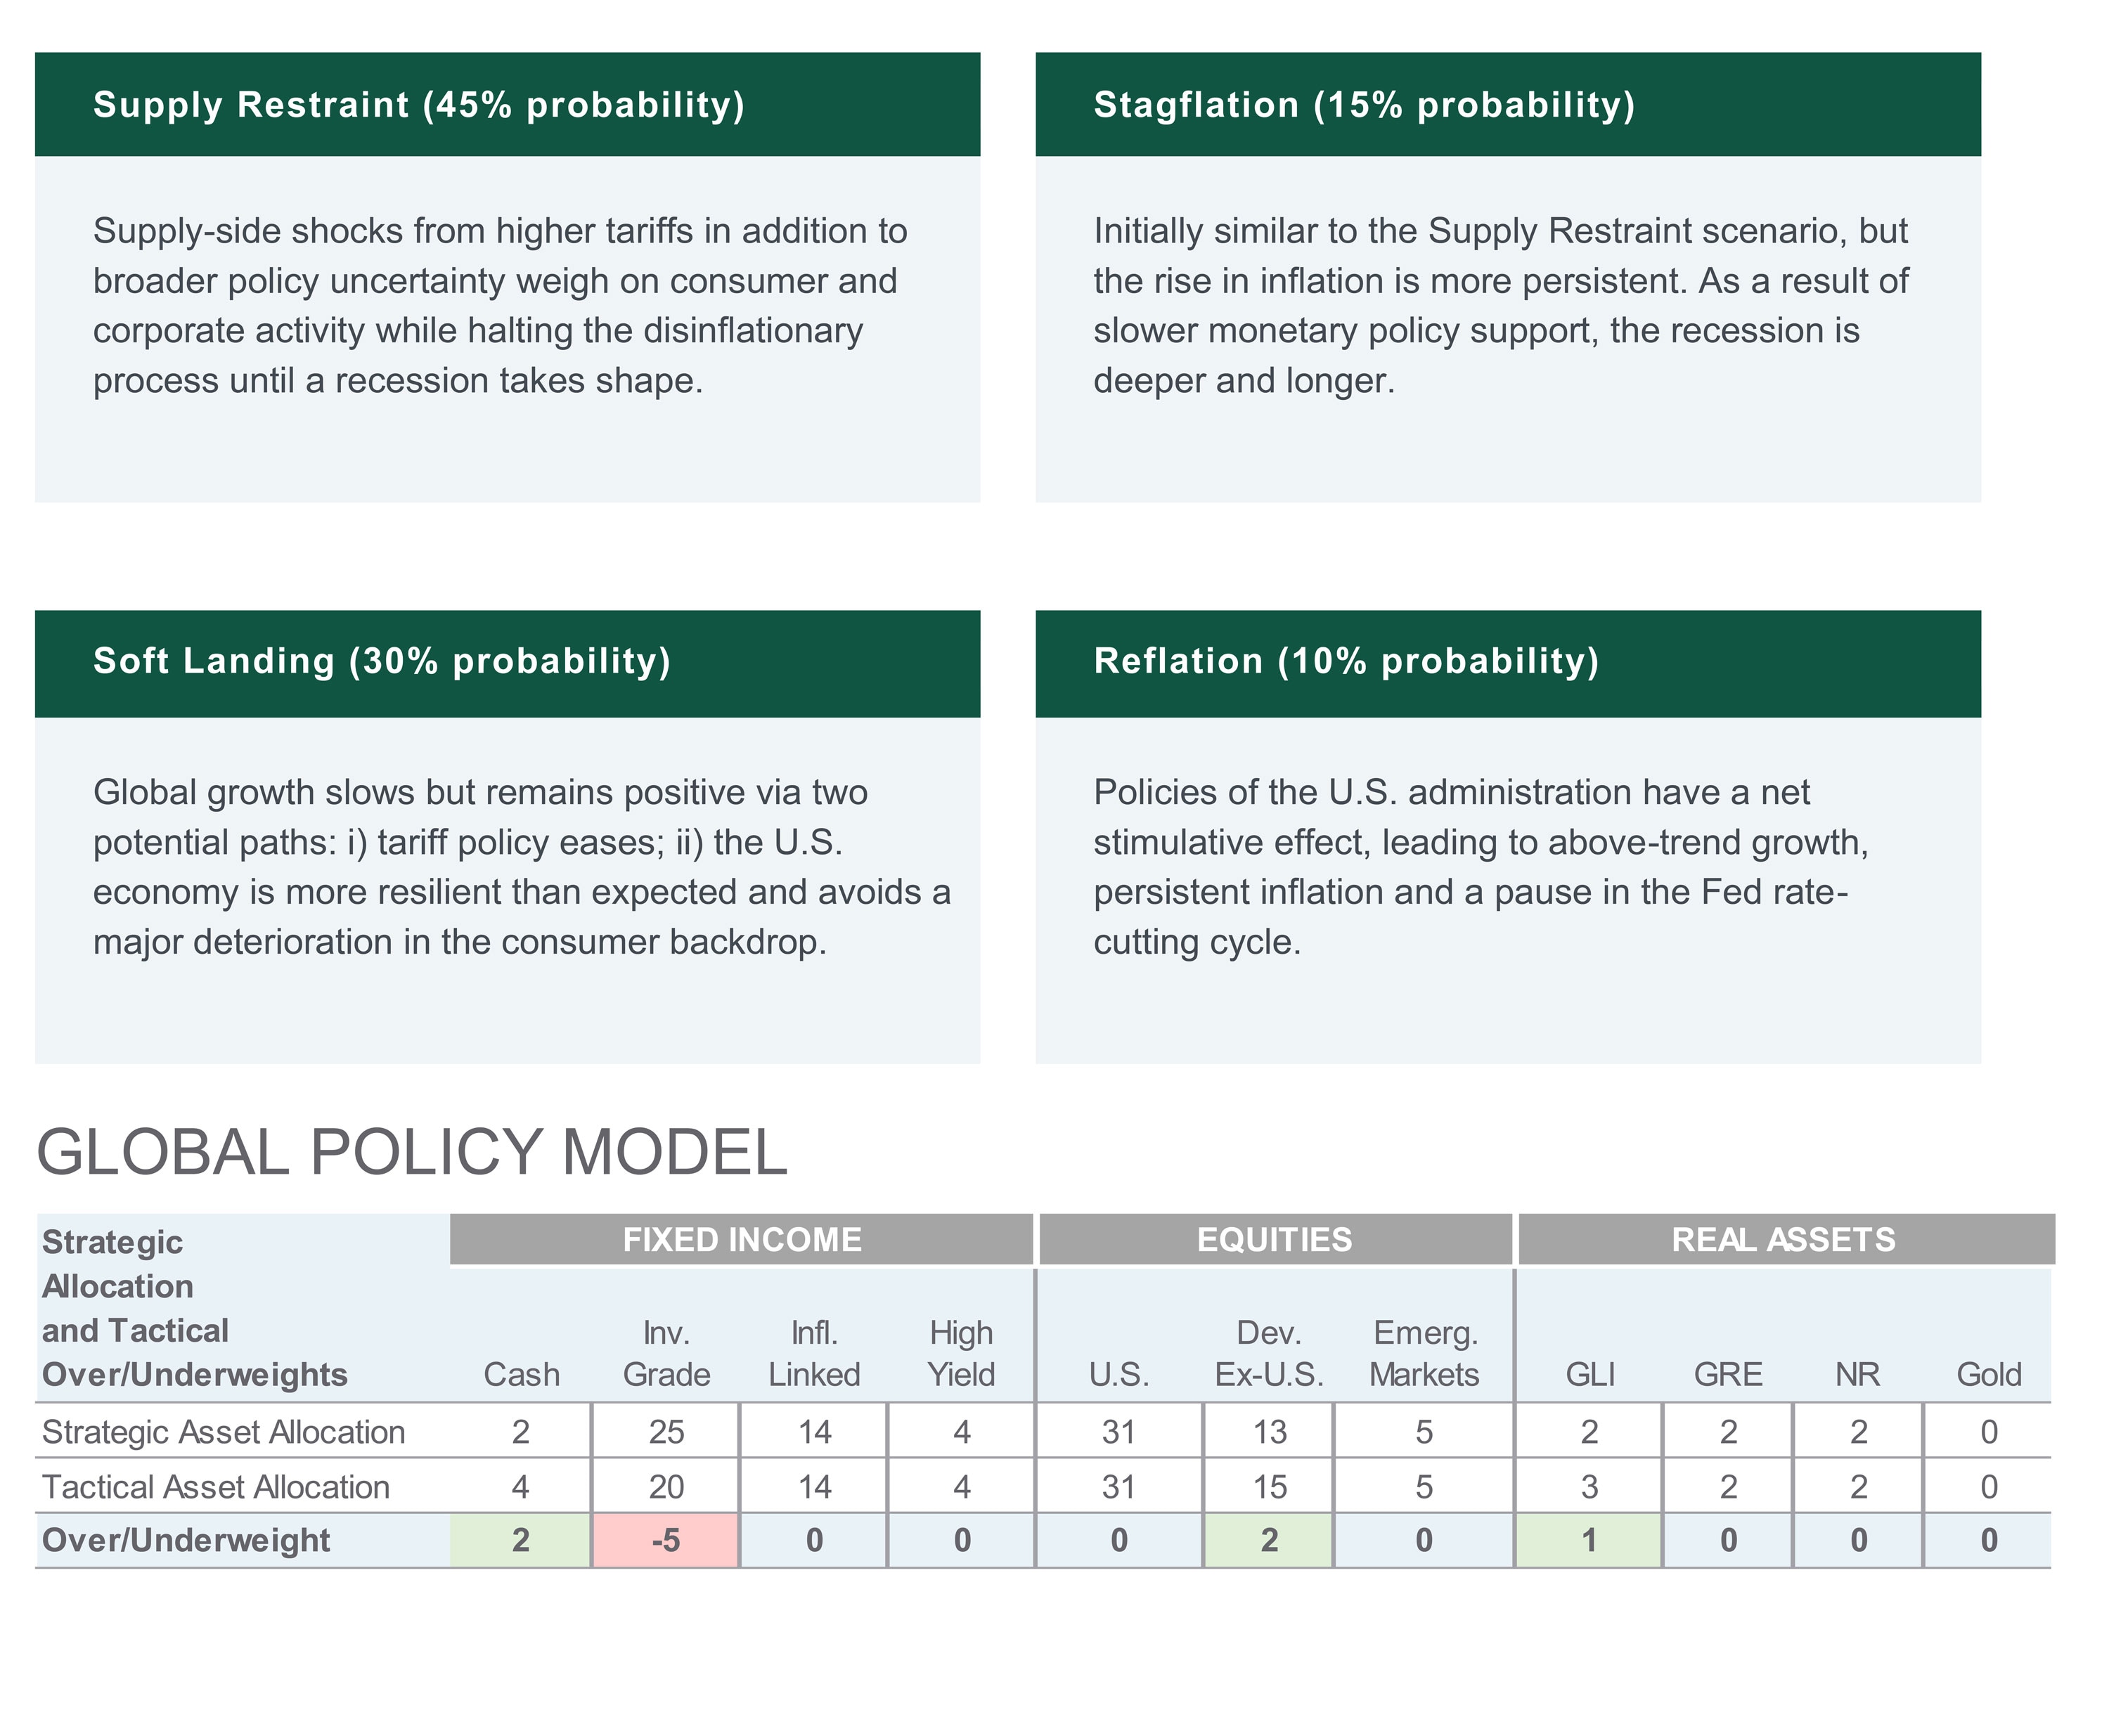
Source: Northern Trust Capital Market Assumptions Working Group, Investment Policy Committee. Strategic allocation is based on capital market return, risk and correlation assumptions developed annually; most recent model released 1/15/2025.The model cannot account for the impact that economic, market and other factors may have on the implementation and ongoing management of an actual investment strategy. Asset allocation does not guarantee a profit or protection against a loss in declining markets. GLI = Global Listed Infrastructure, GRE = Global Real Estate, NR = Natural Resources. Unless otherwise noted, the statements expressed herein are solely opinions of Northern Trust. Northern Trust does not make any representation, assurance, or other promise as to the accuracy, impact, or potential occurrence of any events or outcomes expressed in such opinions.
UNLESS NOTED OTHERWISE, DATA IN THIS PIECE IS SOURCED FROM BLOOMBERG AS OF MAY 2025..
Main Point
Tariff Reversal Sparked Rally, but Uncertainty Lingers
Markets bounced after a surprise rollback in U.S.-China tariffs, but the rebound may not reflect lasting strength. With valuations stretched and policy signals mixed, investors are reassessing risk, and considering more flexible, fundamentals-driven strategies.

Contact Us
Interested in learning more about our expertise and how we can help?
MSCI USA IMI: The MSCI USA Investable Market Index (IMI) is designed to measure the performance of the large, mid and small cap segments of the U.S. market. With 2,319 constituents, the index covers approximately 99% of the free float-adjusted market capitalization in the U.S.
IMPORTANT INFORMATION
The information contained herein is intended for use with current or prospective clients of Northern Trust Investments, Inc (NTI) or its affiliates. The information is not intended for distribution or use by any person in any jurisdiction where such distribution would be contrary to local law or regulation. Northern Trust Asset Management’s (NTAM) and its affiliates may have positions in and may effect transactions in the markets, contracts and related investments different than described in this information. This information is obtained from sources believed to be reliable, its accuracy and completeness are not guaranteed, and is subject to change. Information does not constitute a recommendation of any investment strategy, is not intended as investment advice and does not take into account all the circumstances of each investor.
This information is provided for informational purposes only and is not intended to be, and should not be construed as, an offer, solicitation or recommendation with respect to any transaction and should not be treated as legal advice, investment advice or tax advice. Recipients should not rely upon this information as a substitute for obtaining specific legal or tax advice from their own professional legal or tax advisors. References to specific securities and their issuers are for illustrative purposes only and are not intended and should not be interpreted as recommendations to purchase or sell such securities. Indices and trademarks are the property of their respective owners. Information is subject to change based on market or other conditions.
All securities investing and trading activities risk the loss of capital. Each portfolio is subject to substantial risks including market risks, strategy risks, advisor risk, and risks with respect to its investment in other structures. There can be no assurance that any portfolio investment objectives will be achieved, or that any investment will achieve profits or avoid incurring substantial losses. No investment strategy or risk management technique can guarantee returns or eliminate risk in any market environment. Risk controls and models do not promise any level of performance or guarantee against loss of principal. Any discussion of risk management is intended to describe NTAM’s efforts to monitor and manage risk but does not imply low risk.
Past performance is not a guarantee of future results. Performance returns and the principal value of an investment will fluctuate. Performance returns contained herein are subject to revision by NTAM. Comparative indices shown are provided as an indication of the performance of a particular segment of the capital markets and/or alternative strategies in general. Index performance returns do not reflect any management fees, transaction costs or expenses. It is not possible to invest directly in any index. Net performance returns are reduced by investment management fees and other expenses relating to the management of the account. Gross performance returns contained herein include reinvestment of dividends and other earnings, transaction costs, and all fees and expenses other than investment management fees, unless indicated otherwise. For U.S. NTI prospects or clients, please refer to Part 2a of the Form ADV or consult an NTI representative for additional information on fees.
Forward-looking statements and assumptions are NTAM’s current estimates or expectations of future events or future results based upon proprietary research and should not be construed as an estimate or promise of results that a portfolio may achieve. Actual results could differ materially from the results indicated by this information. Historical trends are not predictive of future results.
Northern Trust Asset Management is composed of Northern Trust Investments, Inc., Northern Trust Global Investments Limited, Northern Trust Fund Managers (Ireland) Limited, Northern Trust Global Investments Japan, K.K., NT Global Advisors, Inc., 50 South Capital Advisors, LLC, Northern Trust Asset Management Australia Pty Ltd, and investment personnel of The Northern Trust Company of Hong Kong Limited and The Northern Trust Company.
Not FDIC insured | May lose value | No bank guarantee