The Weekender
- Who We Serve
- What We Do
- About Us
- Insights & Research
- Who We Serve
- What We Do
- About Us
- Insights & Research
Investment Perspective · 03.27.26
Save to bookmarks
Timing and Measuring Energy Supply Risks
Geopolitical disruption has tightened oil markets, reintroducing supply risk and volatility. The outlook hinges on how long constraints persist — and how growth, inflation, and policy respond.
- Volatility & Risk
- Multi-Asset Insights
- Markets & Economy
Format
Change Format: Choose the format you prefer, and we'll remember your preference next time.
Timing and Measuring Energy Supply Risks
Save to bookmarks
Save to bookmarks
Key Points
Markets are caught between hopes of de‑escalation and anxiety over sustained energy supply risks as the conflict in Iran unfolds.
Limited visibility on how quickly normal energy flows can resume will likely keep volatility elevated and risk premiums embedded in energy prices for the foreseeable future.
For investors, the episode highlights the fragility of global supply chains, the influence of geopolitics and the importance of remaining flexible in an unsettled environment.
Financial markets were caught off guard by the sudden attack on Iran, which swiftly transformed a previously oversupplied crude oil market into a much tighter one due to the effective closure of the Strait of Hormuz. Despite widespread expectations that oil supply would far exceed demand, the disruption of this critical transit route reversed market dynamics and reintroduced acute energy supply risks. Just as markets were pricing a benign outlook for oil, geopolitics reminded investors, economists and policymakers how fragile energy security remains.
Threats to exports and potential regional escalation have forced investors to reassess the likelihood of sustained volatility and higher prices. Markets are now caught between hope and anxiety. There is widespread anticipation that fighting will soon abate, allowing oil flows to stabilize. Yet, the uncertainty surrounding the duration and depth of the supply shock is profound. Ultimately, this is what will likely matter for markets. History suggests that even temporary disruptions can have lasting effects on market psychology and price formation. The lack of clarity on how quickly normalcy can return is likely to keep volatility elevated, with risk premiums embedded in energy prices for the foreseeable future.
The price shock is most severe for oil‑importing economies. Rising crude costs, compounded by stronger dollar exchange rates, threaten to squeeze margins, lift inflation, and weigh on growth — particularly in Europe and Asia, which are more exposed than the U.S.
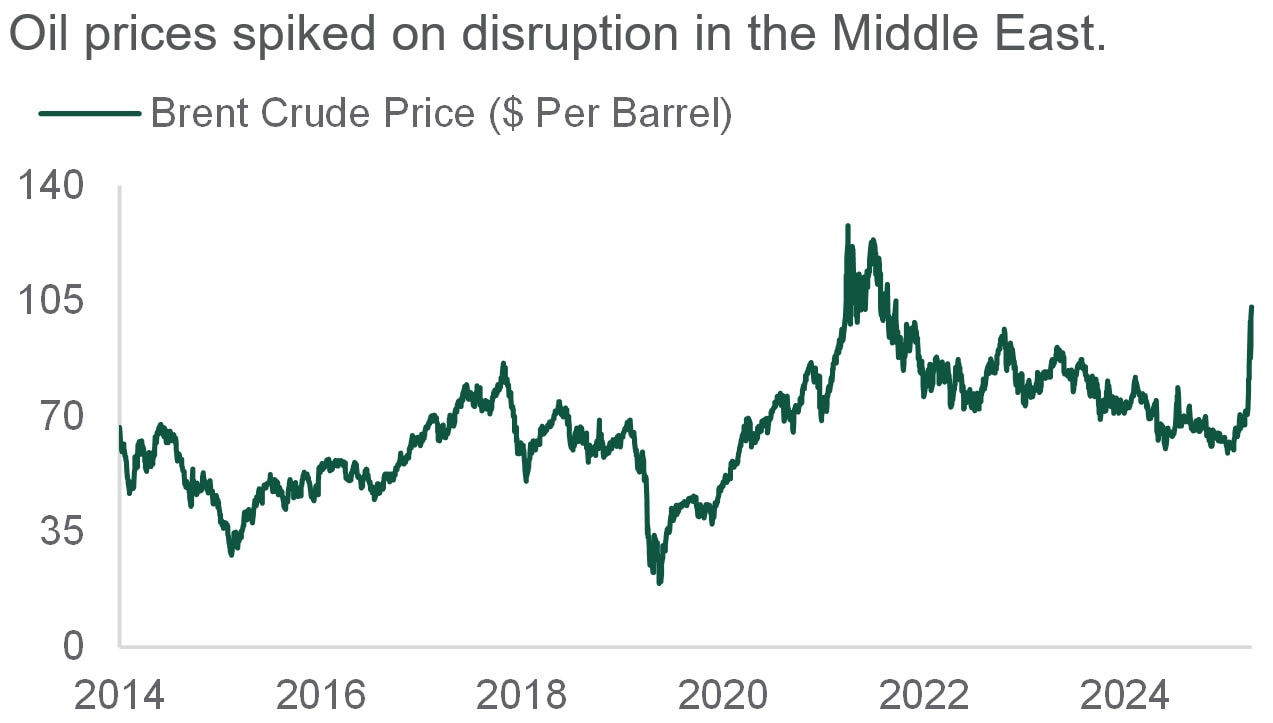
Globally, the balance of risks has shifted toward lower growth and higher inflation. A sustained 10% rise in energy prices could reduce global real GDP by 0.1–0.3% and add 20–40 basis points to headline inflation, with more limited pass‑through to core prices. At $100 per barrel, Brent crude oil is roughly 45% above its 2025 average (less in real terms). Impacts should be manageable if prices ease soon, and consensus forecasts remain largely unchanged — implying de‑escalation remains the baseline expectation. Prolonged disruption, however, has the potential to produce material global effects, particularly for net energy importers.
Strategic stockpile releases provide only temporary relief. They cannot resolve uncertainty over the Strait of Hormuz, which carries nearly a third of global seaborne oil. Normalization depends on both de‑escalation and diplomatic efforts to secure this corridor.
Central banks are therefore likely to stay cautious. Elevated energy prices complicate easing efforts, pushing policymakers toward a wait‑and‑see stance. For investors, the episode underscores the fragility of supply chains, the power of geopolitics, and the need for vigilance and flexibility in navigating an unsettled landscape.
— Peter Wilke, CFA – Head of Tactical Asset Allocation, Global Asset Allocation
A MAJOR THREAT TO SUPPLY
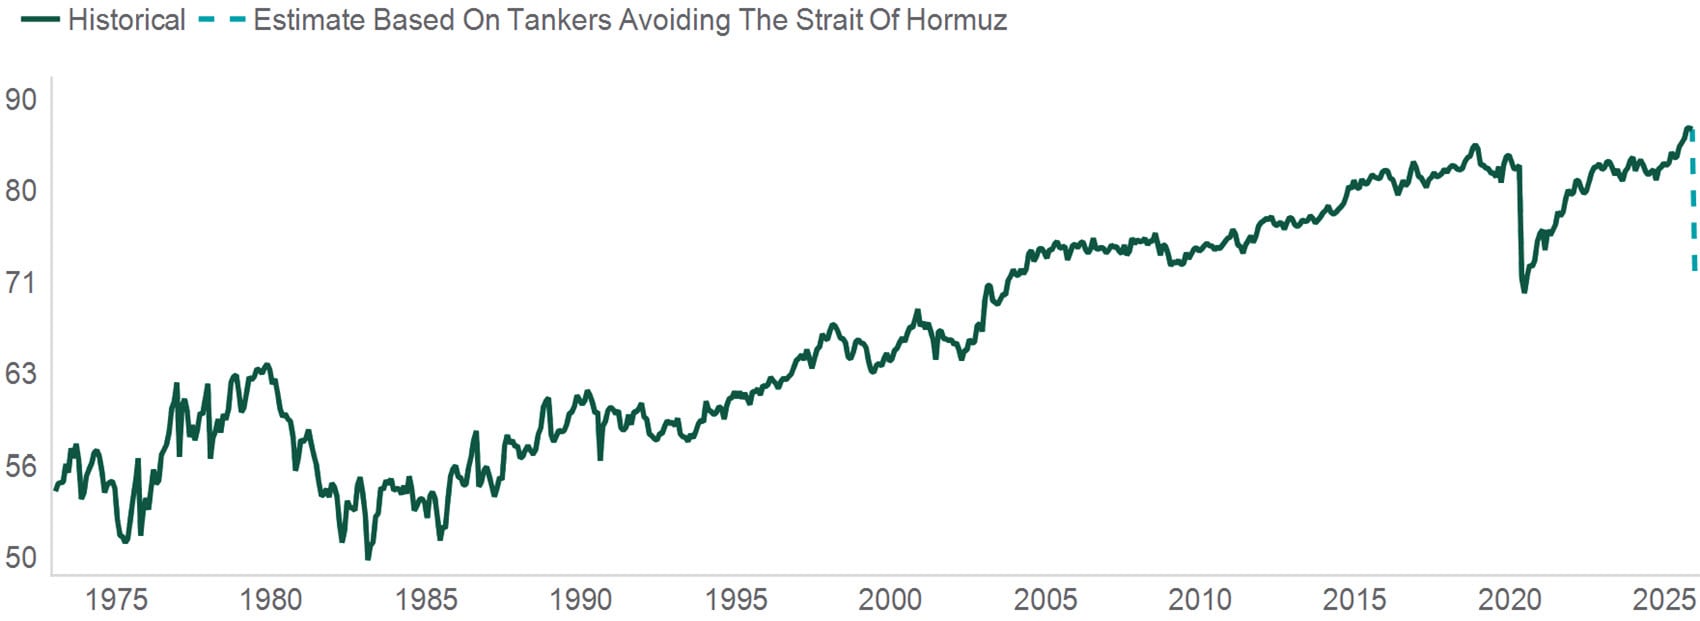
Source: Financial Times, U.S. Energy Information Administration, Macrobond. Data is on a log scale through November 2025. Historical trends are not predictive of future results. Forecasts are subject to change without notice.
Interest Rates
Recently, the U.S. Treasury Department announced modest reductions to T‑Bill supply. As expected, short‑dated tenor auctions — such as one‑month, six‑week, and two‑month — were trimmed after earlier increases this year. This follows a normal seasonal pattern, as the Treasury funds tax refunds via bill issuance in February and March, followed by a paydown in supply approaching the April 15 tax deadline.
While this pattern has had little impact on bill yields so far, there are additional cross‑currents to monitor. Tax law changes last year suggest refunds may be larger than in 2024. While the Treasury Department likely has better visibility and has planned issuance accordingly, the timing and size of refunds remain a wildcard for bill supply. In addition, recent court rulings on tariffs may require refunds. Although the timing and magnitude remain uncertain, a one‑off refund of roughly $175 billion could likely be absorbed by the bill market with limited yield disruption.
Overall, bill supply has behaved seasonally, and for now, changes in implied market pricing for future rate cuts remain a larger driver of bill yields than supply dynamics.
— Dan LaRocco, Head of Liquidity, Global Fixed Income
Rangebound
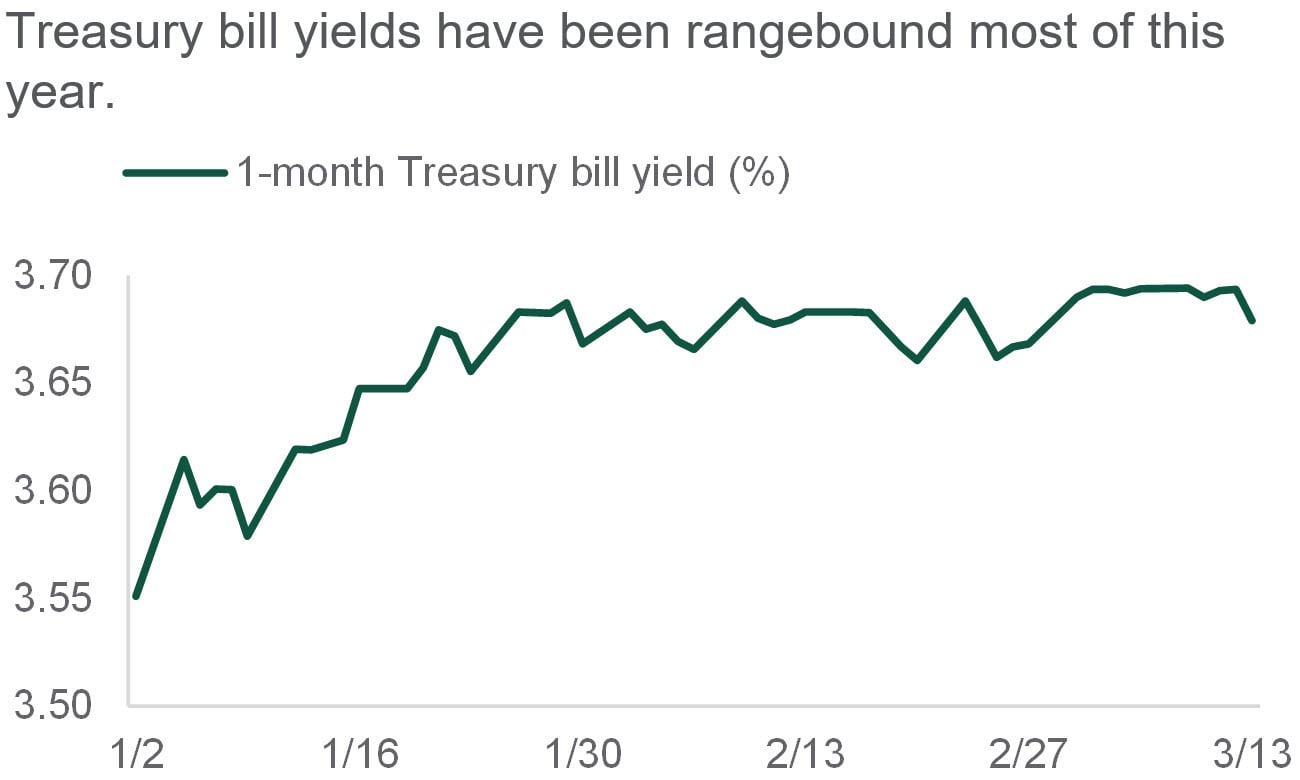
Source: Northern Trust Asset Management, Bloomberg. Data from 12/31/2025 through 3/13/2026. Historical trends are not predictive of future results.
- While T-bill supply has followed normal seasonal patterns, we continue to monitor for any deviations.
- T-bill yields have largely been rangebound to start the year.
- Our Money Market Funds remain neutral duration in light of normal seasonal issuance dynamics.
Credit Markets
February saw continued volatility across equity and debt markets related to artificial intelligence (AI) disruption. There was significant dispersion, as consumer discretionary and tech-related sectors broadly sold off while utilities and energy rallied. This year’s “AI fear trade” has affected numerous parts of credit markets, putting modest upward pressure on credit spreads.
Within credit markets, performance has remained bifurcated across high yield bonds and bank loans. The loan market has higher exposure to software due to the fact that it has historically been the preferred avenue for sponsors seeking leveraged buyout financings. Sponsors were particularly interested in high-margin, high-growth software companies at that time, with tech making up an above-average proportion of total private equity deal value from 2020 to 2022. As a result, cumulative software loan and high yield bond maturities reach $21bn through 2027, with an additional $62bn in 2028 and $74bn in 2029. However, loans make up the vast majority of the refinancing needs. 88% of 2028 maturities are loans and 67% of 2029 maturities are loans. This difference could lead to increased refinancing risks for leveraged loans.
— Ben McCubbin and Sau Mui, Co-Heads of High Yield
Software Maturity Wall
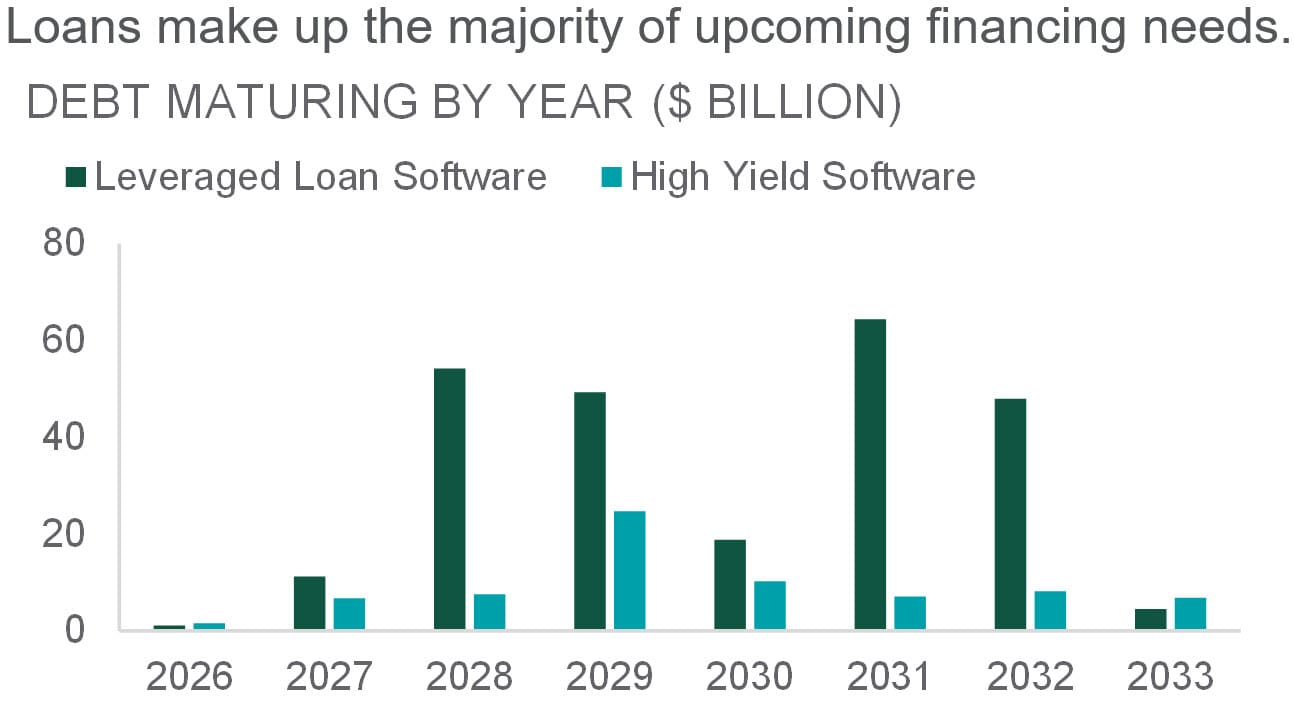
Source: Northern Trust Asset Management, Bloomberg. Data as of February 2026. Historical trends are not predictive of future results.
- Within credit markets, performance has remained bifurcated across high yield bonds and bank loans.
- There are $21bn of software loans and high yield bonds maturing by the end of 2027, but an additional $62bn and $74bn mature in 2028 and 2029, respectively.
- Loans make up the vast majority of the refinancing needs within this cohort.
Equities
Equities have been more volatile since the onset of the Middle East conflict in late February, when tensions grew into a regional confrontation and an effective closure of the Strait of Hormuz triggered a sharp rise in energy prices.
European stocks have underperformed U.S. markets given greater sensitivity to energy‑related shocks and weaker sentiment. Through the first two weeks of the conflict, Europe has seen roughly twice the decline of the U.S. market, with a weaker Euro further amplifying losses for U.S.‑based investors. Sharp increases in energy prices and local government bond yields emerged as key pressure points, coinciding with the most pronounced equity drawdowns and reinforcing the dominance of top‑down forces during this volatile period. Looking ahead, we maintain a cautiously constructive view on global equities as a whole. We continue to support a modest overweight to equities, expressed through a tactical overweight to U.S. and emerging market equities. We trimmed our exposure to developed ex-U.S. equities to neutral, preferring to reduce equity exposure in regions we view as most vulnerable to sustained energy disruptions.
— Jordan Dekhayser, Senior Equity Client Portfolio Manager and Daniel Kim, Associate Equity Client Portfolio Manager
Equity Jolt
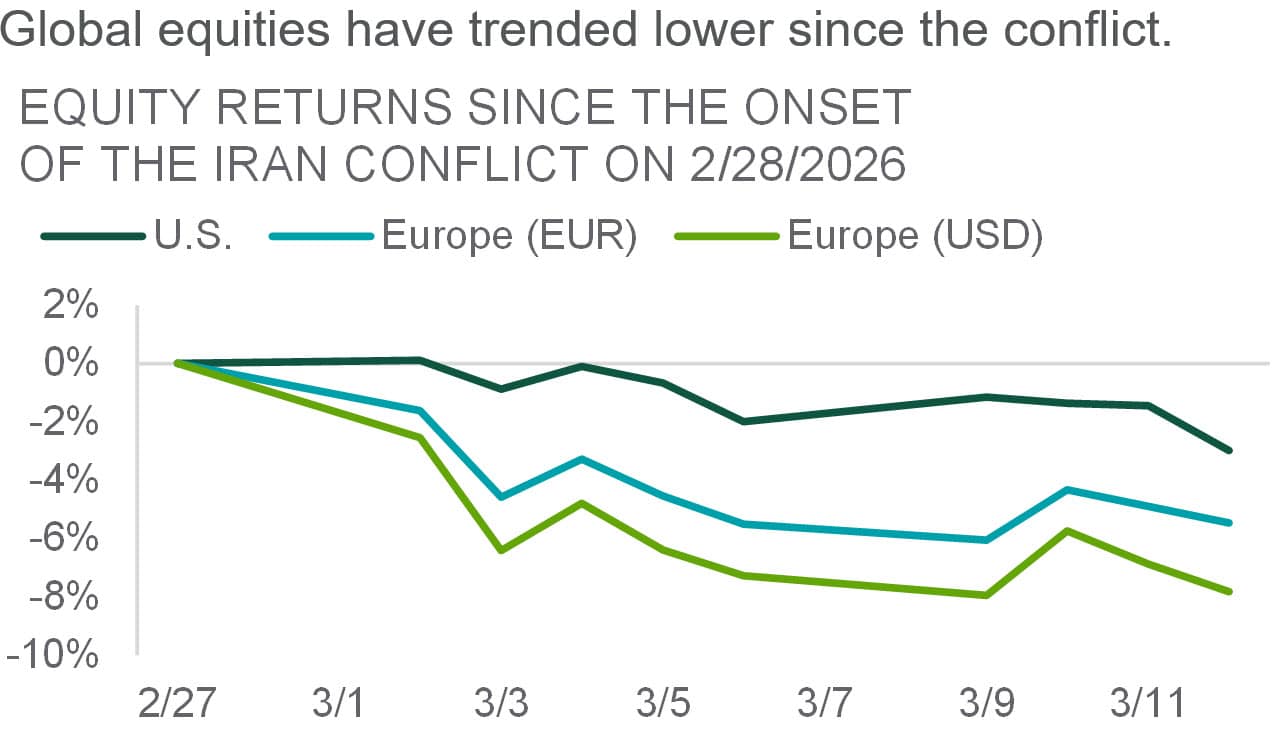
Source: Northern Trust Asset Management, Bloomberg, MSCI. Data from 2/27/2026 through 3/12/2026. Past performance is not indicative or a guarantee of future results. Index performance returns do not reflect any management fees, transaction costs or expenses. It is not possible to invest directly in any index.
- Europe has faced concurrent energy and rate headwinds.
- The timing of the equity drawdowns aligns with the largest oil moves.
- We have reduced our tactical overweight to developed ex-U.S. equities to equal-weight. We prefer U.S. and emerging market equities in this environment.
Real Assets
Brent crude has risen above $90 per barrel as escalating geopolitical tensions involving Iran, the United States, and key Gulf producers have disrupted oil production and export flows across the Middle East. The conflict has increased risks around critical energy infrastructure and key shipping routes, particularly the Strait of Hormuz, through which a significant share of global oil supply normally transits. Even limited disruptions or threats to transit have been enough to tighten supply conditions and push prices higher, as markets price in the possibility of prolonged outages.
At the same time, the conflict has amplified concerns about broader regional stability, raising the likelihood of production curtailments and delayed exports from major energy producers. With spare capacity limited and alternative routes unable to fully offset disruptions, oil markets have responded by embedding a higher risk premium, keeping prices elevated despite intermittent signs of easing. The Iran conflict has effectively turned geographic chokepoints into hard supply constraints, accelerating both the perception and reality of resource scarcity.
— Jim Hardman, Head of Real Assets, Multi-Manager Solutions
Oil on Edge
Source: Northern Trust Asset Management, Bloomberg. Data through 3/13/2026. Historical trends are not predictive of future results.
- Oil markets have priced in a higher risk premium given conflict in the Middle East.
- The conflict has accelerated both the perception and reality of resource scarcity.
- We reaffirmed our tactical overweight to natural resource equities and global listed infrastructure.
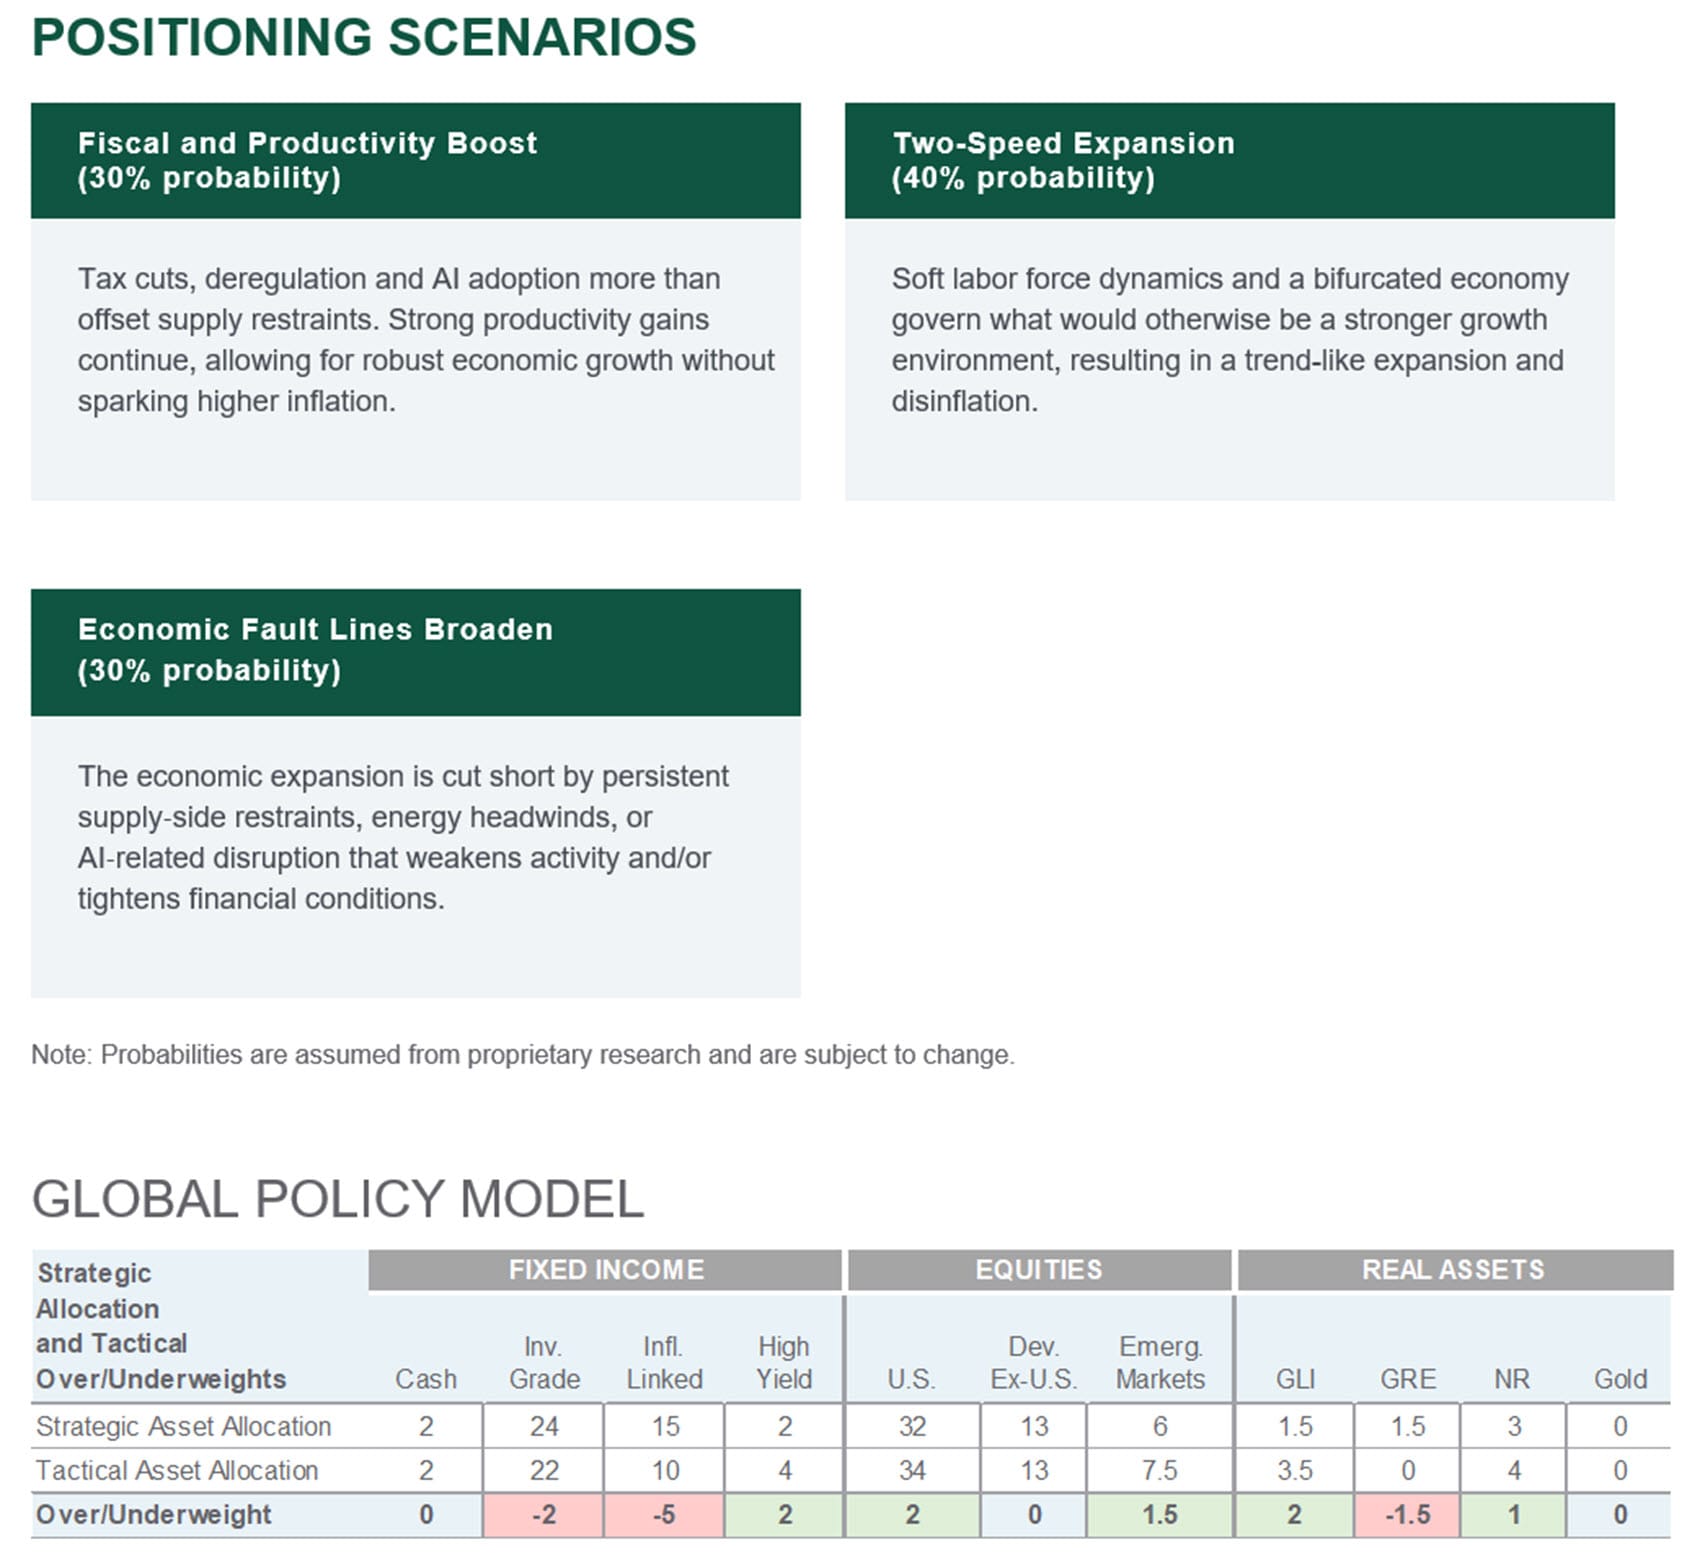
Source: Northern Trust Capital Market Assumptions Working Group, Investment Policy Committee. Strategic allocation is based on capital market return, risk and correlation assumptions developed annually; most recent model released 1/14/2026. The model cannot account for the impact that economic, market and other factors may have on the implementation and ongoing management of an actual investment strategy. Asset allocation does not guarantee a profit or protection against a loss in declining markets. GLI = Global Listed Infrastructure, GRE = Global Real Estate, NR = Natural Resources. Unless otherwise noted, the statements expressed herein are solely opinions of Northern Trust. Northern Trust does not make any representation, assurance, or other promise as to the accuracy, impact, or potential occurrence of any events or outcomes expressed in such opinions.
Unless noted otherwise, data is sourced from Bloomberg as of March 2026.
Main Point
Geopolitics and the Return of Energy Risk
Geopolitical conflict has tightened oil markets, reversing expectations of supply abundance and elevating volatility. With uncertainty around how quickly energy flows normalize, risks to growth, inflation, and policy remain skewed and uneven across regions.

Contact Us
Interested in learning more about our expertise and how we can help?
{{msci_world_index}}
IMPORTANT INFORMATION
The information contained herein is intended for use with current or prospective clients of Northern Trust Investments, Inc (NTI) or its affiliates. The information is not intended for distribution or use by any person in any jurisdiction where such distribution would be contrary to local law or regulation. Northern Trust Asset Management’s (NTAM) and its affiliates may have positions in and may effect transactions in the markets, contracts and related investments different than described in this information. This information is obtained from sources believed to be reliable, its accuracy and completeness are not guaranteed, and is subject to change. Information does not constitute a recommendation of any investment strategy, is not intended as investment advice and does not take into account all the circumstances of each investor.
This information is provided for informational purposes only and is not intended to be, and should not be construed as, an offer, solicitation or recommendation with respect to any transaction and should not be treated as legal advice, investment advice or tax advice. Recipients should not rely upon this information as a substitute for obtaining specific legal or tax advice from their own professional legal or tax advisors. References to specific securities and their issuers are for illustrative purposes only and are not intended and should not be interpreted as recommendations to purchase or sell such securities. Indices and trademarks are the property of their respective owners. Information is subject to change based on market or other conditions.
All securities investing and trading activities risk the loss of capital. Each portfolio is subject to substantial risks including market risks, strategy risks, advisor risk, and risks with respect to its investment in other structures. There can be no assurance that any portfolio investment objectives will be achieved, or that any investment will achieve profits or avoid incurring substantial losses. No investment strategy or risk management technique can guarantee returns or eliminate risk in any market environment. Risk controls and models do not promise any level of performance or guarantee against loss of principal. Any discussion of risk management is intended to describe NTAM’s efforts to monitor and manage risk but does not imply low risk.
Past performance is not a guarantee of future results. Performance returns and the principal value of an investment will fluctuate. Performance returns contained herein are subject to revision by NTAM. Comparative indices shown are provided as an indication of the performance of a particular segment of the capital markets and/or alternative strategies in general. Index performance returns do not reflect any management fees, transaction costs or expenses. It is not possible to invest directly in any index. Net performance returns are reduced by investment management fees and other expenses relating to the management of the account. Gross performance returns contained herein include reinvestment of dividends and other earnings, transaction costs, and all fees and expenses other than investment management fees, unless indicated otherwise. For U.S. NTI prospects or clients, please refer to Part 2a of the Form ADV or consult an NTI representative for additional information on fees.
Forward-looking statements and assumptions are NTAM’s current estimates or expectations of future events or future results based upon proprietary research and should not be construed as an estimate or promise of results that a portfolio may achieve. Actual results could differ materially from the results indicated by this information. Historical trends are not predictive of future results.
Northern Trust Asset Management is composed of Northern Trust Investments, Inc., Northern Trust Global Investments Limited, Northern Trust Fund Managers (Ireland) Limited, Northern Trust Global Investments Japan, K.K., NT Global Advisors, Inc., 50 South Capital Advisors, LLC, Northern Trust Asset Management Australia Pty Ltd, and investment personnel of The Northern Trust Company of Hong Kong Limited and The Northern Trust Company.
Not FDIC insured | May lose value | No bank guarantee