Related Content
- Who We Serve
- What We Do
- About Us
- Insights & Research
- Who We Serve
- What We Do
- About Us
- Insights & Research
Point of View · 09.09.24
Save to bookmarks
Municipal Bonds: Fiscal 2025 State Outlook
States enter fiscal 2025 maintaining stable reserves and moderating fixed costs, yet we expect many will need to make modest spending cuts due to exhaustion of federal pandemic aid.
- Fixed Income
- Markets & Economy
- Market & Investment Trends
- Economic Insights & Trends
Municipal Bonds: Fiscal 2025 State Outlook
Save to bookmarks
Save to bookmarks
Key Points
What it is
States are proactively maintaining stable reserves, providing a cushion as tax revenues soften, while also prioritizing budget sustainability in light of dwindling one-time federal aid.
Why it matters
Resiliency is key to state credit quality, given economic risks as well as the increasing severity and frequency of natural disasters, alongside uncertainty around federal disaster aid.
Where it's going
We see state resiliency as high, and even the weakest states are showing improvement as they build reserves and improve pension funding.
State reserves stable; revenues begin to weaken, sparking spending cuts
Higher interest rates have contributed to the cooling of the economy, with the Federal Reserve signaling likely rate cuts in the coming months. Slower economic growth has contributed to softening tax revenues in some states. In our view, states are generally well-prepared for potential economic weakness due to their strong reserves and moderate fixed costs.
Threats of the U.S. economy entering a recession have fallen over the past year with the economy continuing to grow, albeit at a slower pace, which has caused many states to see slower tax collection growth and a shifting mix of tax sources.
After strong fiscal revenue growth in 2021 and 2022, state revenues in 2023 were estimated to have declined around 1.1% according to the National Association of State Budget Officers (NASBO). Final tallies for fiscal 2024 are not yet available, but we expect tax revenues to be slightly above flat. NASBO projects fiscal year 2025 will return to more normal growth of 1.6%.
States took advantage of the strong revenue growth in 2021 and 2022 by building significant reserves. Total “rainy day fund” reserve balances grew from $77 billion in fiscal 2020 to $135 billion as fiscal 2022 closed and to over $136 billion through fiscal 2023 despite weaker revenues. As shown in Exhibit 1, median reserves have now increased to over 13% of annual budgets and over 23% when other fund balances are included.
EXHIBIT 1: STATES STRENGTHEN FISCAL SAFETY NETS AMID REVENUE GROWTH
“Rainy day” funds surge, with median reserves now over 13% of annual budgets.
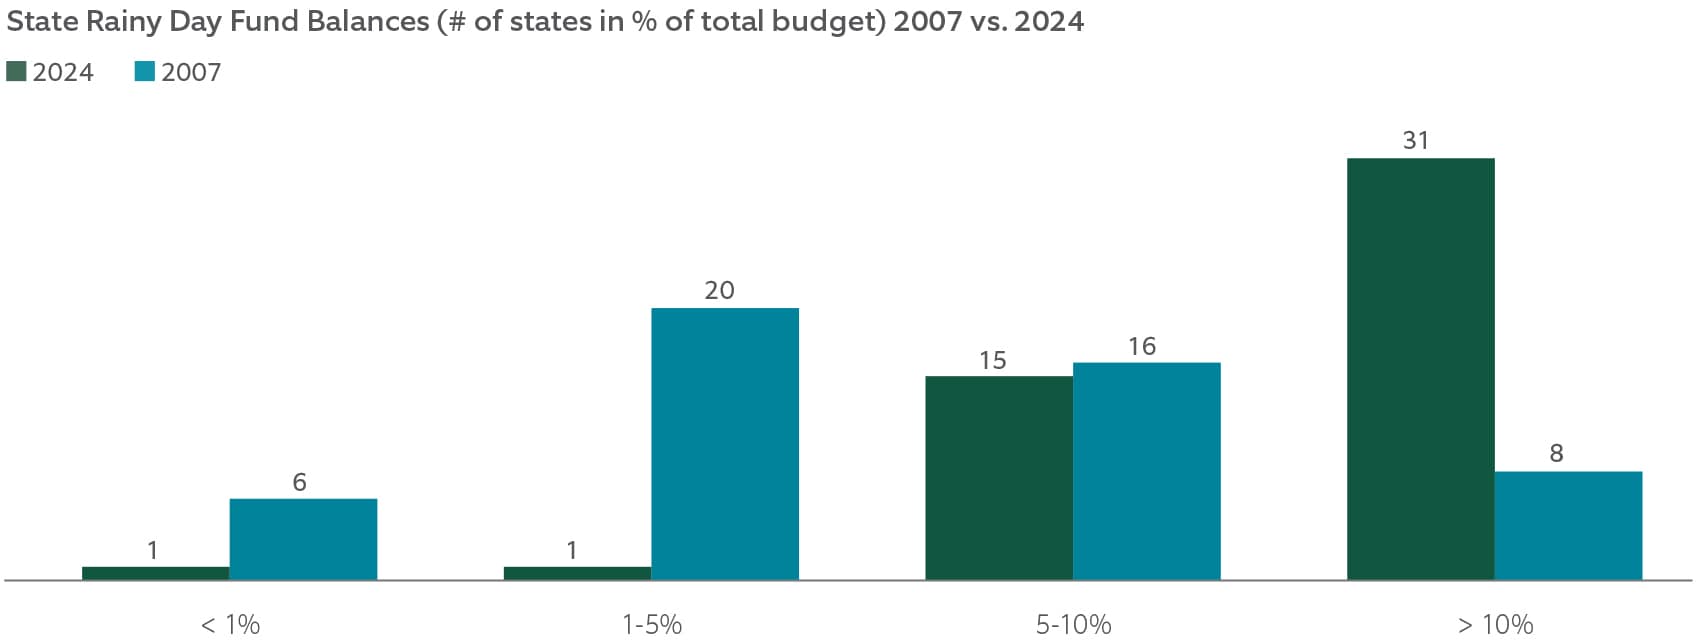
Source: National Association of State Budget Officers, Survey of the States, 2024.
The two primary sources of state tax revenues are income and sales taxes (Exhibit 2). Sales tax growth has remained stable (helped by inflation). Still, income tax has notably softened, particularly in states that are more reliant on capital gains and those that enacted rate cuts — some through automatic adjustments based on reserves. At the start of 2024, eight states enacted lower income tax rates.
EXHIBIT 2: STATE TAX REVENUE SOURCES FACE DIVERGING TRENDS
Sales tax growth stays strong with inflation, while income tax revenues weaken in states with capital gains reliance and new rate cuts.
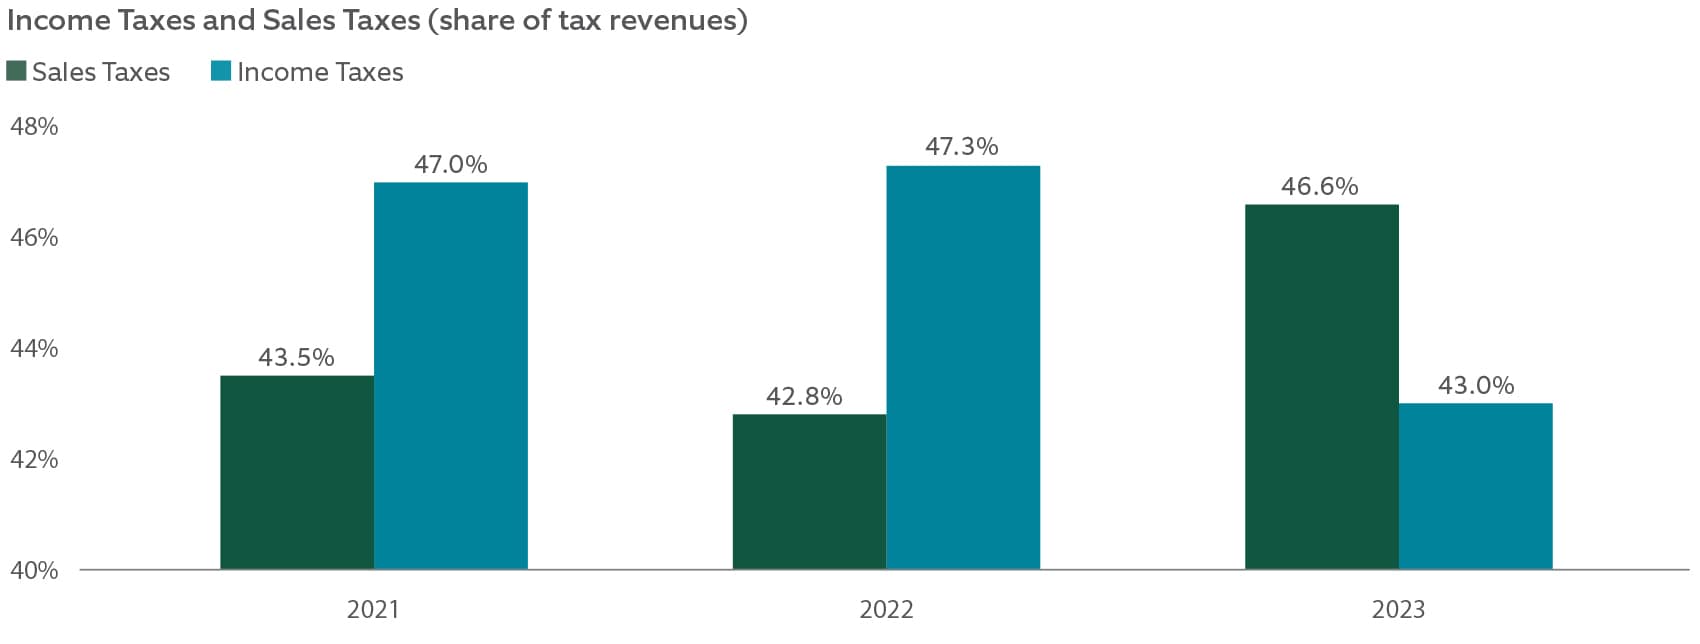
Source: U.S. Census Bureau’s 2023 Annual Survey of State Government Tax Collections.
In recent months, several states enacted tax cut measures:
• Kansas: The legislature approved reducing personal income tax brackets from three levels to two and exempting Social Security income from taxation. These changes and other tax cuts are expected to reduce tax revenues by over $500 million in 2025, which is just under 5% of the annual general fund budget.
• Illinois: The state will eliminate its statewide 1% grocery tax starting in 2026, which offsets tax increases on sports betting.
• Hawaii: The state passed a new budget with reductions in state income taxes, with projections to eliminate the tax for 40% of the population by 2031.
Softening revenues and the exhaustion of federal pandemic aid have tempered state spending for fiscal 2025. Pew Charitable Trusts analysis shows expected general fund spending across states is down approximately 6% for fiscal 2025, similar to the rate of decline experienced during the Global Financial Crisis.
Examples include California, which reduced one-time spending to reallocate resources to core services, and Arizona, which cut higher education spending to close projected deficits. Budget cuts preserve the reserves built up over the past few years and provide cushion against future budget shocks.
State resiliency
Even well-managed states experience financial volatility. During recessions, state budgets tend to be squeezed by declining tax revenues and rising cost for safety net programs. Unexpected events such as natural disasters, terrorist attacks, civil unrest, or pandemics can also radically change state budget forecasts. States have fiscal tools to manage these events, including raising new revenues, reducing or delaying spending, refinancing debt, borrowing, or use of reserves. These sovereign powers are a key part of why we favor state bonds.
On a relative basis, state resiliency varies (Exhibit 3). Key factors in evaluating state resiliency include:
• Reserves: Reserves increase a government’s fiscal safety margin. Reserve accumulation is especially significant for states with volatile revenue structures, such as New York, which has a heavy dependence on capital gains, and Alaska, which has a heavy dependence on oil revenues.
• Fixed Costs: Legacy costs like pensions, retiree health, and reduce budgeting flexibility. Illinois, for example, expects to spend over $10 billion on pensions and nearly $2 billion on debt service in fiscal 2025, more than 22% of its $53 billion budget.
• Management: We prefer states that budget conservatively and can quickly change revenue forecasts when conditions warrant and adjust spending if necessary. In Delaware, for example, the state appropriates only 98% of expected revenues, providing a cushion for revenue shortfalls. In Ohio, if the governor believes tax receipts will be less than appropriations, they must order state agencies to reduce spending. Well-managed states also act to improve resiliency to disasters and other event risks.
Debt service coverage
Debt service coverage is the ratio of a company’s cash flow or earnings to interest expenses, an indicator of the ability of a company to make interest payments on debt.
EXHIBIT 3: COMPARING STATE RESILIENCY IN CHALLENGING TIMES
Varying levels of state resilience reflect differences in fiscal strength, management strategies, and budget stability — or a combination of these factors.
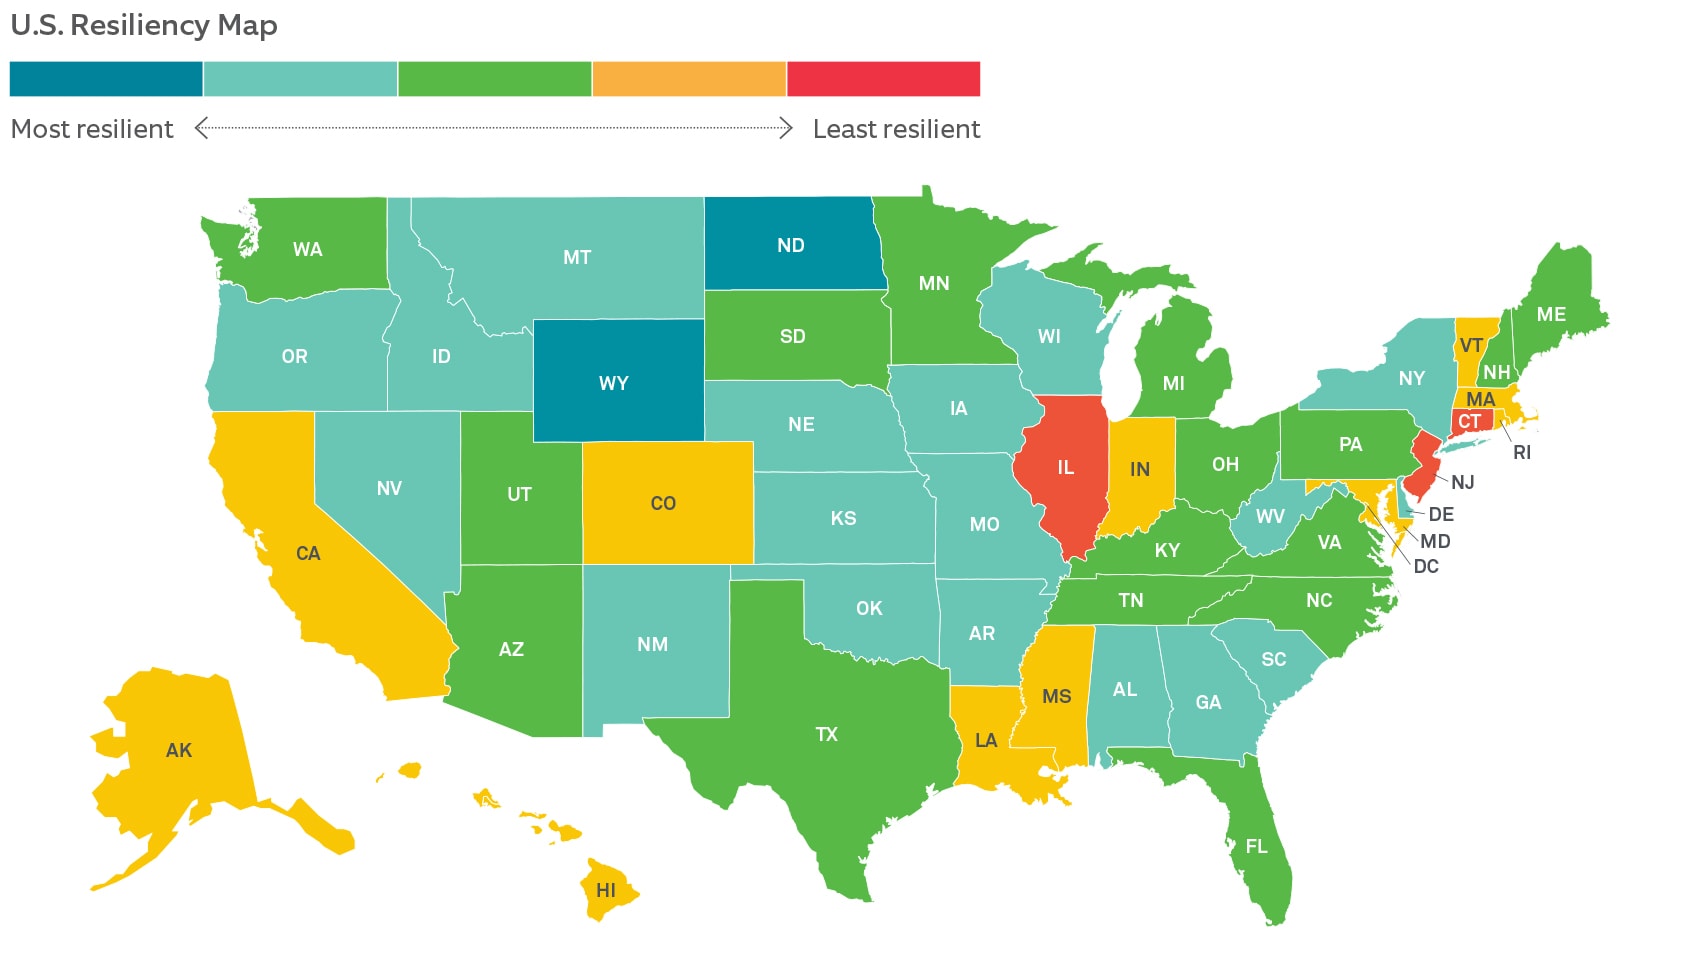
Source: Northern Trust Asset Management, our view of resiliency applies to the year starting July 1, 2024.
Event risk and states
States depend on the federal government for fiscal assistance in recovering from major disasters. Aid flows from Federal Emergency Management Agency (FEMA) programs and one-time Congressional appropriations. The federal government responded generously to major events like the 2001 terrorist attacks, Hurricane Katrina (2005), Hurricane Sandy (2012), and recent wildfires. However, this aid is not guaranteed, and recent trends raise concerns that future disaster aid may not be as generous.
The federal deficit has reached record levels at nearly $2 trillion in fiscal 2024, constraining the government’s financial capacity. Simultaneously, the frequency of costly disasters increased dramatically, with the U.S. now experiencing 20 disasters per year that exceed $1 billion or more in damages, compared to an average of just five in the early 2000s. Additionally, the growing divisiveness in American politics may hinder the passage of future aid bills.
The rise in costs and risk of waning federal support underscores the need for resiliency among states. It also emphasizes the importance of solid governance that plans for disasters and works to harden key assets — the federal Bipartisan Infrastructure and Jobs Act of 2021 assisted by providing funds for climate resilience.
Some states have greater vulnerability to event risk than others. Exhibit 4 shows the risk of costly wildfires, hurricanes, and floods by state.
EXHIBIT 4: POTENTIAL RISE IN STATE DISASTER RISKS
The number of expensive disasters is rising, and future federal aid is not guaranteed.
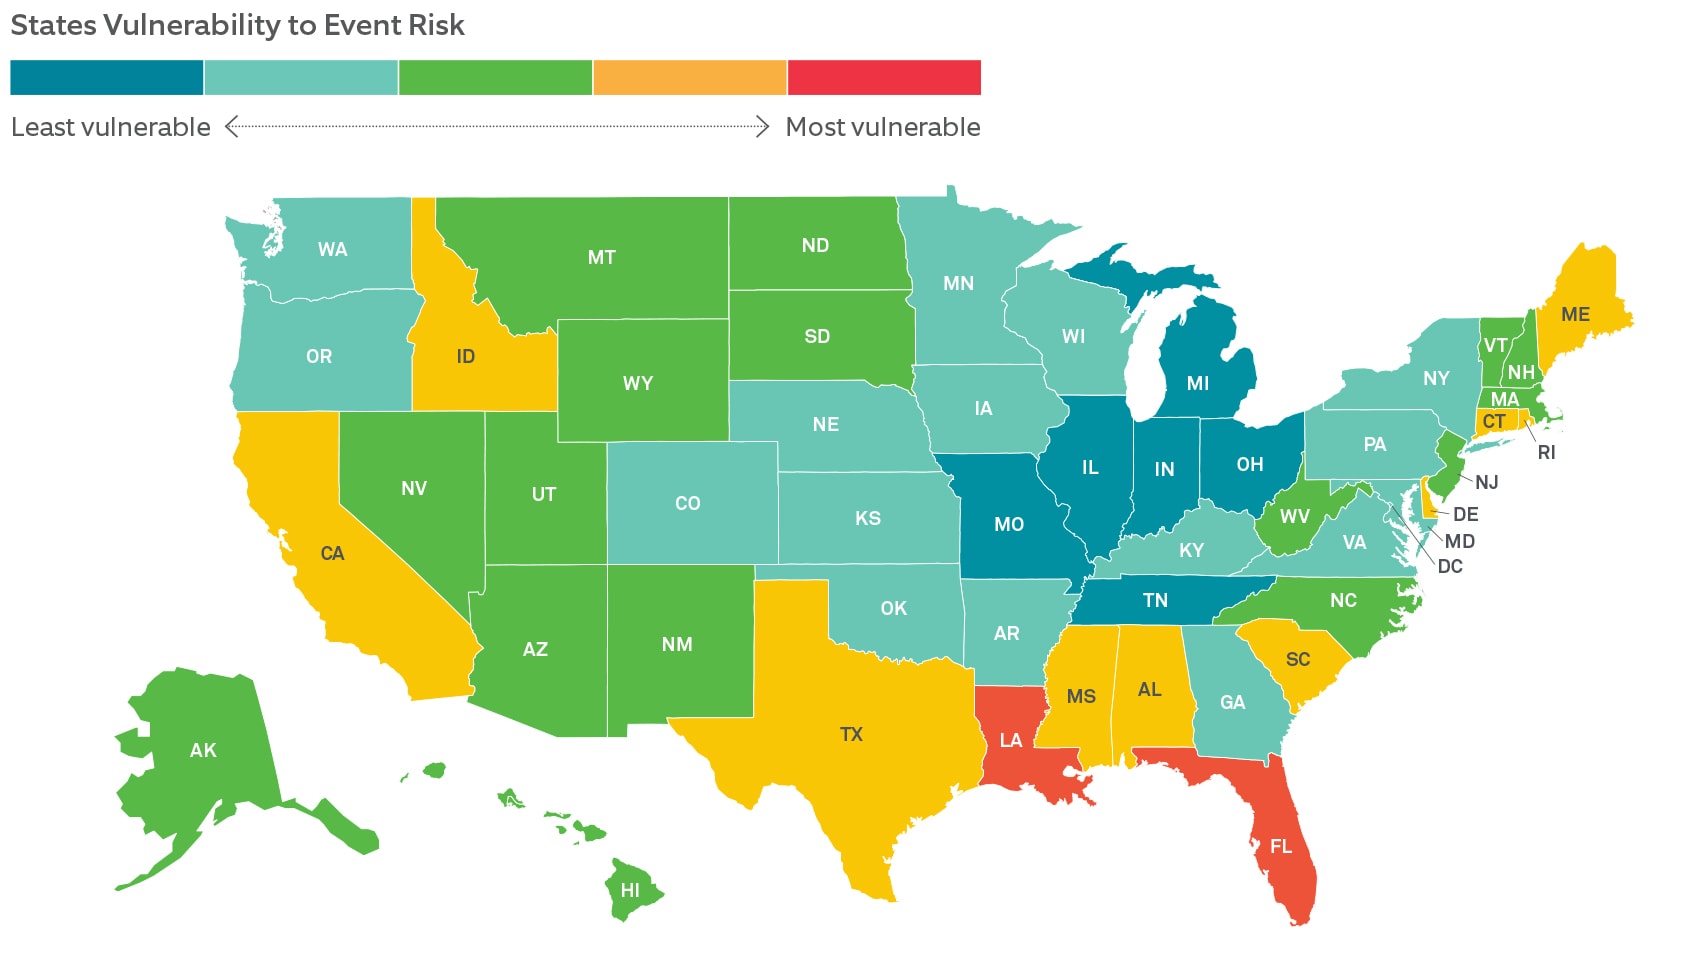
Source: Northern Trust Asset Management, risQ, July 2024.
Weakest states strengthen but remain near the bottom
Illinois (fourth largest), New Jersey (seventh largest), and Connecticut (nineteenth largest) are among the major municipal bond-issuing states. Their have recently improved, but all three, notably Illinois, remain weak compared to peers. The improvements are mainly due to a build-up in reserves, restrained , and better pension funding, including the use of surpluses to make extra pension deposits. However, the impact of these achievements is tempered by lower reserves, high pension liabilities, and slower economic and population growth compared to state peer medians.
We have recently added to positions in these three states as their credit has improved and they built resiliency against future economic slowdowns. Bonds from these states typically offer more yield than other states, although these yield spreads have shrunk over the last two years as credit conditions have improved and each state has received rating agency upgrades.
Eye on California
Golden State issuers make up over 16% of the municipal market, by far the most of any state. California’s tax revenues are volatile, largely due to its resilience on a highly progressive income tax and the boom-and-bust nature of its large tech industry. This volatility is evident in the state’s tax revenues, which jumped from $140 billion in fiscal 2020 to $232 billion in fiscal 2022, driven by rapid growth in income taxes. California took this opportunity to build a large reserve, which was then needed as tax revenues fell to just $180 billion in fiscal 2023.
The state has used some of its reserves and implemented spending cuts in response to the revenue decline. It recently passed fiscal 2025 budget, which allocates $211 billion, down from $223 billion in fiscal 2024 and $243 billion in fiscal 2022. California now expects to end fiscal 2025 with nearly $18 billion in reserves and $14 billion in a total of 13% of its annual budget.
We remain constructive on California’s credit due to strong reserves and liquidity, reduced debt levels, and strong management.
What this means for municipal bond investors
States as an asset class enter fiscal 2025 in strong positions due to sizable reserves and moderating fixed costs. Yet, we expect that many states will need to make modest spending cuts to continue that flexibility given slowing revenues and exhaustion of federal pandemic aid. We expect the economy to stay out of recession, but if a moderate recession occurs, state resiliency should remain strong, limiting credit downgrades and market volatility. We continue to consider to be a crucial part of core municipal portfolios.
General obligation credits
General obligation credits are a type of municipal bond backed by the full faith and credit of the issuing state, meaning the state promises to use all available resources to repay the debt.
Debt issuance
Debt issuance is when a state raises money by selling bonds or taking loans, which it promises to repay with interest.
Unrestricted fund balance
An unrestricted fund balance is the portion of a state’s budget that can be used freely, without restrictions, for any purpose.
Main Point
Municipal Bonds in 2025: Stability Amid Softening Revenues
We continue to consider state bonds to be a crucial part of core municipal portfolios. With healthy reserves and manageable fixed costs, states are well-positioned for fiscal 2025, though some may need to adjust spending due to waning federal pandemic aid.

Contact Us
Interested in learning more about our expertise and how we can help?
IMPORTANT INFORMATION
Northern Trust Asset Management is composed of Northern Trust Investments, Inc., Northern Trust Global Investments Limited, Northern Trust Fund Managers (Ireland) Limited, Northern Trust Global Investments Japan, K.K., NT Global Advisors, Inc., 50 South Capital Advisors, LLC, Northern Trust Asset Management Australia Pty Ltd, and investment personnel of The Northern Trust Company of Hong Kong Limited and The Northern Trust Company.
Issued in the United Kingdom by Northern Trust Global Investments Limited, issued in the European Economic Association (“EEA”) by Northern Trust Fund Managers (Ireland) Limited, issued in Australia by Northern Trust Asset Management (Australia) Limited (ACN 648 476 019) which holds an Australian Financial Services Licence (License Number: 529895) and is regulated by the Australian Securities and Investments Commission (ASIC), and issued in Hong Kong by The Northern Trust Company of Hong Kong Limited which is regulated by the Hong Kong Securities and Futures Commission.
For Asia-Pacific (APAC) and Europe, Middle East and Africa (EMEA) markets, this information is directed to institutional, professional and wholesale clients or investors only and should not be relied upon by retail clients or investors. This information may not be edited, altered, revised, paraphrased, or otherwise modified without the prior written permission of NTAM. The information is not intended for distribution or use by any person in any jurisdiction where such distribution would be contrary to local law or regulation. NTAM may have positions in and may effect transactions in the markets, contracts and related investments different than described in this information. This information is obtained from sources believed to be reliable, its accuracy and completeness are not guaranteed, and is subject to change. Information does not constitute a recommendation of any investment strategy, is not intended as investment advice and does not take into account all the circumstances of each investor.
This information is provided for informational purposes only and is not intended to be, and should not be construed as, an offer, solicitation or recommendation with respect to any transaction and should not be treated as legal advice, investment advice or tax advice. Recipients should not rely upon this information as a substitute for obtaining specific legal or tax advice from their own professional legal or tax advisors. References to specific securities and their issuers are for illustrative purposes only and are not intended and should not be interpreted as recommendations to purchase or sell such securities. Indices and trademarks are the property of their respective owners. Information is subject to change based on market or other conditions.
All securities investing and trading activities risk the loss of capital. Each portfolio is subject to substantial risks including market risks, strategy risks, advisor risk, and risks with respect to its investment in other structures. There can be no assurance that any portfolio investment objectives will be achieved, or that any investment will achieve profits or avoid incurring substantial losses. No investment strategy or risk management technique can guarantee returns or eliminate risk in any market environment. Risk controls and models do not promise any level of performance or guarantee against loss of principal. Any discussion of risk management is intended to describe NTAM’s efforts to monitor and manage risk but does not imply low risk.
Past performance is not a guarantee of future results. Performance returns and the principal value of an investment will fluctuate. Performance returns contained herein are subject to revision by NTAM. Comparative indices shown are provided as an indication of the performance of a particular segment of the capital markets and/or alternative strategies in general. Index performance returns do not reflect any management fees, transaction costs or expenses. It is not possible to invest directly in any index. Net performance returns are reduced by investment management fees and other expenses relating to the management of the account. Gross performance returns contained herein include reinvestment of dividends and other earnings, transaction costs, and all fees and expenses other than investment management fees, unless indicated otherwise. For U.S. NTI prospects or clients, please refer to Part 2a of the Form ADV or consult an NTI representative for additional information on fees.
Forward-looking statements and assumptions are NTAM’s current estimates or expectations of future events or future results based upon proprietary research and should not be construed as an estimate or promise of results that a portfolio may achieve. Actual results could differ materially from the results indicated by this information.
Not FDIC insured | May lose value | No bank guarantee