Resources
- Who We Serve
- What We Do
- About Us
- Insights & Research
- Who We Serve
- What We Do
- About Us
- Insights & Research
Point of View · 11.19.25
Save to bookmarks
How Mapping The Connections Between Companies Can Help Drive Alpha
Using AI tools to collate the vast amount of data published on the companies we track helps us better assess the connections between them. These insights help us refine our investment strategies.
- Equity
- Risk Management
- Factor Investing
- Quantitative
Format
Change Format: Choose the format you prefer, and we'll remember your preference next time.
How Mapping The Connections Between Companies Can Help Drive Alpha
Save to bookmarks
Save to bookmarks
Key Points
What this is
Using AI tools allows us to map the connections between companies and provide data that may prove a vital source of alpha.
Why it matters
The information uncovered using this approach may be particularly valuable as complement to proven quant strategies.
Where it's going
Better understanding of companies and the networks in which they operate will open up new frontiers for alpha generation by quant strategies.
For quantitative strategies, pools of capital that aim to deliver alpha by analyzing vast amounts of data, the advent of Artificial Intelligence (AI) technology such as Natural Language Processing (NLP) powers them towards a new frontier by multiplying in orders of magnitude the amount of information they can harness to deliver investment success.
One area that has proved especially fruitful when it comes to leveraging this explosion in data availability and computing power has been the ability to construct groups, or , of companies and use these to reveal connections and insights that inform investment decisions and strategies. Uncovering the hidden connections among and between companies stands out as a particularly rich and underexploited source of alpha.
Specifically, instead of basing an investment decision solely on a company and its fundamentals, we can now also assess information about the other businesses that the company in question is connected to and use the learnings from those relationships to build more resilient portfolios.
These networks can help us better understand a company’s place within its ecosystem, how it is perceived by competitors, how it interacts within its supply chain and how information about these connections seeps into the market. Capturing this data and using it to fuel investment decisions blends economic insight with data science and can improve returns, for example, by refining the implementation of proven quant strategies.
Today, the most compelling opportunities lie in the nuanced, the uncorrelated and the hidden. A quant strategy that has the ability to identify and capture these previously unavailable data sets, and applies it with economic rigor, gives itself a significant edge.
How we capture information
Over the last decade, the ability to accurately extract information from text has evolved significantly. At the same time, the cost of the computer power required to achieve this has shrunk equally dramatically.
The advent of AI, NLP and large language models (LLMs) has enabled the translation, interpretation and automated processing of company filings and reports, without the need for human (read: fundamental) analysts.
It is estimated that around 50-60% of global data is text-based, rising to 70-80% when assessing data relevant to businesses — annual reports, earnings calls, news articles, and so on.
Even if we narrow the field to a more manageable size, the amount of text is still overpowering — or would have been in the pre-AI age. For example, there are almost 8,300 public companies in the MSCI ACWI IMI index that, in aggregate, have issued ca. 230,000 past and current filings in 21 languages. The computing power available today makes short work of digesting and interpreting this vast wealth of data, irrespective of the language it is in. From an investment standpoint, this makes for an invaluable treasure trove of actionable intelligence.
Any kind of investing relies on access to information, but this is especially the case with quant strategies. We use AI tools to analyze and collate this enormous cache of intel and we use it to build and assess networks; collections of ‘’ and ‘’ representing companies and their linkages. The nodes are the individual entities within the network and the edges are the connections between them.
For us to apply our network theory in practical, investment terms, we need first to vectorize this textual information — that is, we must convert the raw text into numerical data that can be understood and used by algorithms that drive quantitative investment processes. Once we have the data in the form we need it, we can then start to use it to build networks.
Take a supply chain network as an example. Each node is a company within that network while the edges are where they are related, such as supplying parts or distributing products. We might build out this network by assigning weightings to the edges according to the transaction value between two companies in the network, or as a percentage expressing the relative importance of the relationship.
EXHIBIT 1: Supply Chain Network: Nodes and Edges
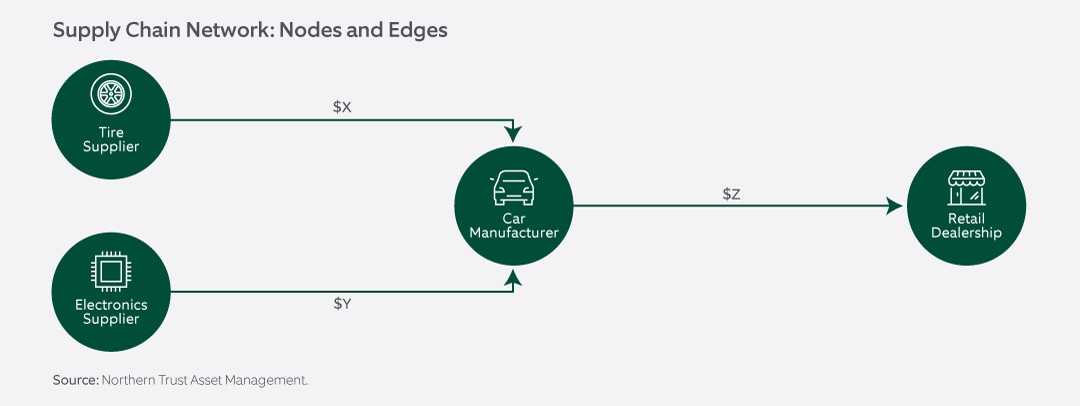
Source: Northern Trust Asset Management
Another example might be a network of companies that are linked by technology. We can build this by using patent-ownership data, such as scraping information from global patent databases. In this scenario, we can assign numerical ratings according to each company’s share of each technology class.
These are but two ways we could map the relationships between sets of businesses. In general, any type of connection between companies can be used to construct a network, applying similar techniques to that described above.
EXHIBIT 2: Example of a more details network of business peers
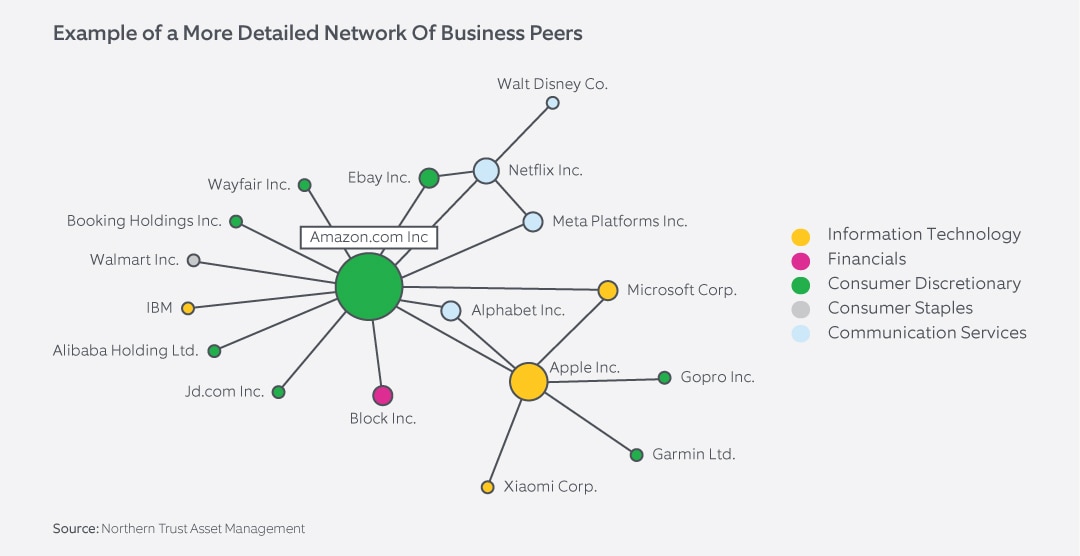
Source: Northern Trust Asset Management
Implications
Having demonstrated ‘the how’, the obvious follow-up question is ‘the why’. What advantage does creating these networks provide to our quantitative strategies in practice?
One of the main benefits is in the way we deploy proven , such as momentum. In momentum investing, an investment is typically predicated on investors under-appreciating good news. One buys into a stock on the expectation that it has further upside. There is a good deal of academic and practitioner insights that suggests that momentum effects are pervasive and persistent. However, these positive trends can reverse, which is clearly something we would want to avoid.
By complementing long-term proven momentum signals, for example based on price information, with network-based momentum, that crash risk can often be reduced substantially. We are looking at companies on a more granular level and gaining a better understanding of the drivers of momentum, based on a stock within its cohort and its network.
Using this network analysis as part of a momentum approach might mean you are not as prone to buying a stock simply because it sits in a certain sector or country that has done well recently. Rather, you rather buy it because of stock specific momentum drivers. These tend to be a much more stable drivers of excess returns and less prone to reversals.
These network insights help us to understand the more persistent drivers of momentum. This allows us to be more efficient and deliberate in allocating our clients’ risk budgets for improved portfolio outcomes.
Looking ahead
As quantitative investors, we are always seeking the next edge. In a world awash with data, the challenge is not scarcity, but discernment. Network-based signals offer a powerful new lens — one that is grounded in economic theory, enabled by modern technology, and validated by empirical results.
The future of quant investing is not just about better models or faster computers. It’s about better context. And in that future, networks allow us to make even better informed and risk-efficient investment decisions.
We want to be able to add consistent incremental excess returns across the portfolio for our clients. And having these risk-managed signals and additional insights from network effects helps to achieve that.
In a world that can feel overwhelming given the sheer volume of information flying at us at all times, having a structured approach to separating fact from fiction and capitalizing on the genuinely useful is another step forward for quant investing.
Main Point
How Mapping Companies’ Connections Can Drive Alpha
Using AI tools to collate the vast amount of data published on companies helps us better assess the connections between them. With the insights derived from creating and analyzing these networks, we can refine our investment strategies and drive alpha.

Contact Us
Interested in learning more about our expertise and how we can help?
IMPORTANT INFORMATION
For Canada, Asia-Pacific (APAC) and Europe, Middle East and Africa (EMEA) markets, this information is directed to institutional, professional and wholesale clients or investors only and should not be relied upon by retail clients or investors. This information may not be edited, altered, revised, paraphrased, or otherwise modified without the prior written permission of NTAM. The information is not intended for distribution or use by any person in any jurisdiction where such distribution would be contrary to local law or regulation. NTAM may have positions in and may effect transactions in the markets, contracts and related investments different than described in this information. This information is obtained from sources believed to be reliable, its accuracy and completeness are not guaranteed, and is subject to change. Information does not constitute a recommendation of any investment strategy, is not intended as investment advice and does not take into account all the circumstances of each investor.
This information is provided for informational purposes only and is not intended to be, and should not be construed as, an offer, solicitation or recommendation with respect to any transaction and should not be treated as legal advice, investment advice or tax advice. Recipients should not rely upon this information as a substitute for obtaining specific legal or tax advice from their own professional legal or tax advisors. References to specific securities and their issuers are for illustrative purposes only and are not intended and should not be interpreted as recommendations to purchase or sell such securities. Indices and trademarks are the property of their respective owners. Information is subject to change based on market or other conditions.
All securities investing and trading activities risk the loss of capital. Each portfolio is subject to substantial risks including market risks, strategy risks, advisor risk, and risks with respect to its investment in other structures. There can be no assurance that any portfolio investment objectives will be achieved, or that any investment will achieve profits or avoid incurring substantial losses. No investment strategy or risk management technique can guarantee returns or eliminate risk in any market environment. Risk controls and models do not promise any level of performance or guarantee against loss of principal. Any discussion of risk management is intended to describe NTAM’s efforts to monitor and manage risk but does not imply low risk.
Past performance is not a guarantee of future results. Performance returns and the principal value of an investment will fluctuate. Performance returns contained herein are subject to revision by NTAM. Comparative indices shown are provided as an indication of the performance of a particular segment of the capital markets and/or alternative strategies in general. Index performance returns do not reflect any management fees, transaction costs or expenses. It is not possible to invest directly in any index. Net performance returns are reduced by investment management fees and other expenses relating to the management of the account. Gross performance returns contained herein include reinvestment of dividends and other earnings, transaction costs, and all fees and expenses other than investment management fees, unless indicated otherwise. For U.S. NTI prospects or clients, please refer to Part 2a of the Form ADV or consult an NTI representative for additional information on fees.
Forward-looking statements and assumptions are NTAM’s current estimates or expectations of future events or future results based upon proprietary research and should not be construed as an estimate or promise of results that a portfolio may achieve. Actual results could differ materially from the results indicated by this information. Historical trends are not predictive of future results.
This information is intended for purposes of NTI and/or its affiliates marketing as providers of the products and services described herein and not to provide any fiduciary investment advice within the meaning of Section 3(21) of the Employee Retirement Income Security Act of 1974, as amended (ERISA). NTI and/or its affiliates are not undertaking to provide a recommendation or give investment advice in a fiduciary capacity to the recipient of these materials, which are for marketing purposes and are not intended to serve as a primary basis for investment decisions. NTI and/or its affiliates may receive fees and other compensation in connection with the products and services described herein as well as for custody, fund administration, transfer agent, investment operations outsourcing, and other services rendered to various proprietary and third-party investment products and firms that may be the subject of or become associated with the services described herein.
Northern Trust Asset Management is composed of Northern Trust Investments, Inc., Northern Trust Global Investments Limited, Northern Trust Fund Managers (Ireland) Limited, Northern Trust Global Investments Japan, K.K., NT Global Advisors, Inc., 50 South Capital Advisors, LLC, Northern Trust Asset Management Australia Pty Ltd, and investment personnel of The Northern Trust Company, The Northern Trust Company (Singapore Branch), and The Northern Trust Company of Hong Kong Limited.
Not FDIC insured | May lose value | No bank guarantee