- Who We Serve
- What We Do
- About Us
- Insights & Research
- Who We Serve
- What We Do
- About Us
- Insights & Research
Buy America
While uncertainties remain, solid fundamentals and supportive conditions suggest U.S. markets could continue to outperform.
- Portfolio Construction
- Multi-Asset Insights
- Equity Insights
- Fixed Income Insights
Key Points
What it is
We examine the outlook for U.S. equities, high yield bonds, and real assets, considering their potential amid resilient growth, corporate profits, and monetary shifts.
Why it matters
Getting expert insight on U.S. market dynamics can help investors identify potential opportunities while managing risks in an evolving global economy.
Where it's going
The U.S. outlook suggests that equities may continue to drive growth, but maintaining a balanced portfolio will be key as economic conditions and policy impacts evolve.
Since 1987, the average annual return of a portfolio consisting of 60% stocks1 and 40% bonds2 has been 8%. So far in 2024, it is up 12%, the second consecutive year of above-average returns for balanced portfolios. Global equities have gained 19%, led by U.S. large caps. Fixed income has produced lower but positive returns, as high yield bonds have buffered modest performance from high-grade credit and Treasurys. Going forward, we expect more modest gains for 60/40 portfolios with U.S. equities leading the charge again.
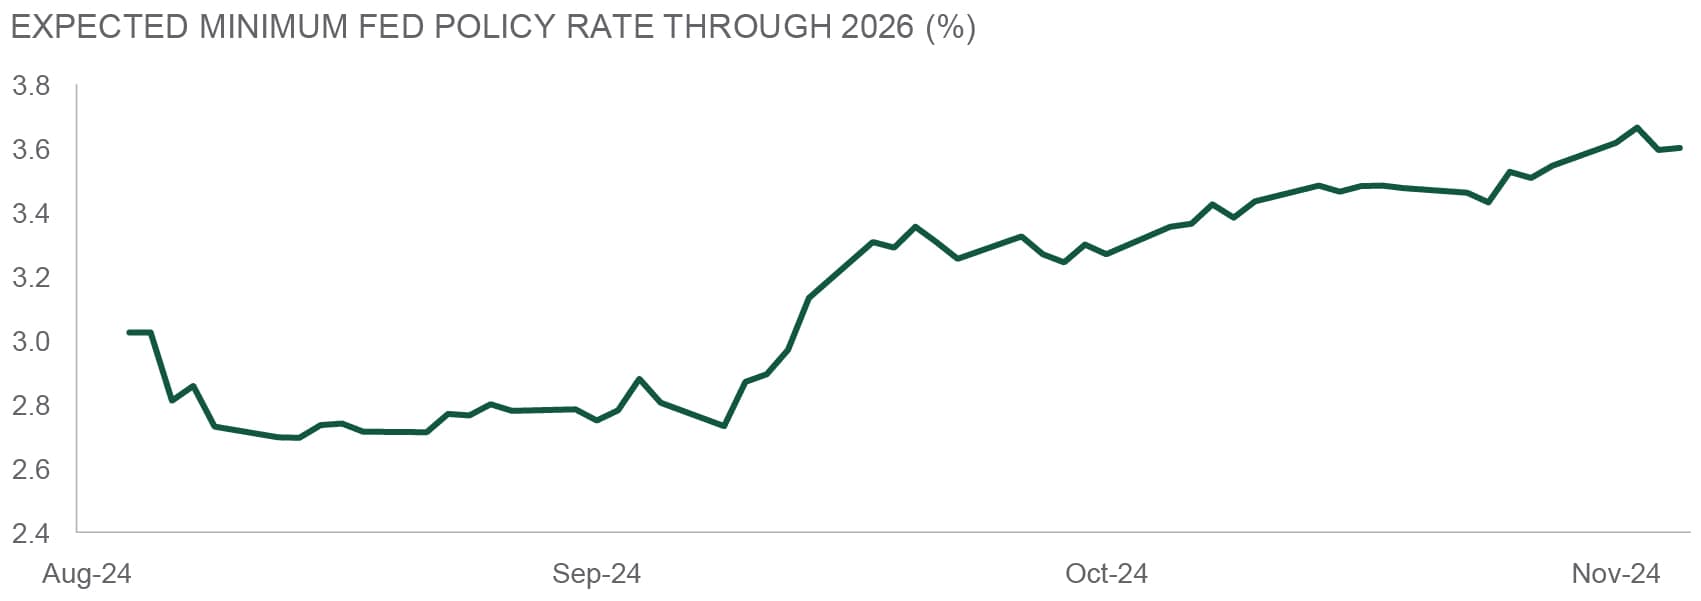
We maintain a preference for equities over fixed income, reflecting our base case of continued economic growth. As shown in the exhibit, the expected level at which the Federal Reserve policy rate settles this cycle has materially increased since mid-September. We believe this reflects a mix of stronger growth expectations and risk of higher inflation.
Our top two risk cases incorporate the possibility of inflation as a result of potential U.S. presidential policies. In the more benign risk scenario, stronger growth accompanies inflation. We believe this would result in equities outperforming fixed income. Equities historically have been able to maintain today’s valuations with inflation at or even above 4%, but growth is important. In the second risk scenario, there is no positive growth impulse. We would expect higher inflation to weigh on equities and most other major assets, with few other assets such as gold ending up as beneficiaries.
“Buy America” is another one of our key tactical calls. We expect U.S. equities to benefit from a better economic backdrop and healthier corporate profits than most other regions. We also believe that non-U.S. companies are more negatively exposed to the policies floated by the incoming U.S. government. For example, higher tariffs likely would weigh on Chinese and European company profits, while non-U.S. regions would see little benefit from U.S. tax cuts and reduced regulation. With that said, there is a wide range of potential outcomes, supporting regional diversification in a portfolio.
Within fixed income, we continue to like high yield. Its starting yield of above 7% is attractive given strong fundamentals and a supportive technical backdrop. We see more limited upside for investment grade credit and Treasurys given historically tight investment grade and low odds of a sharp drop in rates. Given we do see incrementally higher inflation risks as a result of possible policies from the U.S. government, we think some inflation protection through inflation-linked bonds is prudent.
— Anwiti Bahuguna, Ph.D. – Chief Investment Officer, Global Asset Allocation
Spread refers to the difference in yield between bonds of different credit qualities.
HIGHER EXPECTATIONS
The expected level at which the Fed policy rate settles this cycle has increased since mid-September.

Source: Northern Trust Asset Management, Bloomberg. Consensus expectations for the Fed Funds rate through 2026. Expectations are from 8/31/2024 through 11/13/2024. Historical trends are not predictive of future results. 1As represented by the MSCI All World Country Index (ACWI), which tracks the performance of equities globally. 2As represented by the Bloomberg U.S. Aggregate Bond Index, which tracks to performance of the U.S. bond market. Index performance returns do not reflect any management fees, transaction costs or expenses. It is not possible to invest in any index.
Interest Rates
Intuition may suggest that as yields on money market funds move lower along with policy rates they would be less attractive and drive outflows, but we’ve seen the opposite in 2024, consistent with historical experience. Money market fund industry AUM has increased by more than half a trillion dollars, setting all-time-high records throughout the year. Money market fund AUM has been going up even as rates are going down.
As a reminder, changes in the Federal Funds Target range are the biggest driver of changes in money market fund yields. While we agree with market pricing for the remainder of 2024, uncertainty around the economic outlook and monetary policy in 2025 has increased substantially. A fairly wide range of outcomes with respect to the Federal Funds Target range are possible. While we believe the Fed will continue to gradually cut its policy rate, we and the markets see little chance that rates return to the zero lower bound anytime soon – a welcome change from much of the past 15 years of very low yields on cash.
— Dan LaRocco, Head of U.S. Liquidity, Global Fixed Income
MONEY FUNDS UP WHILE RATES HAVE COME DOWN
Despite less attractive yields, money market fund AUM has continued to increase.

Source: Northern Trust Asset Management, Bloomberg, Investment Company Institute (ICI). Data from 1/3/2024 through 11/13/2024. AUM = Assets under management. Historical trends are not predictive of future results.
- Money Market Fund AUM has been going up even as rates are going down.
- Uncertainty around the outlook for monetary policy in 2025 has increased substantially.
- We’ll continue to monitor money markets closely for any signs of stress that may impact Fed balance sheet policy.
Credit Markets
High yield saw the weakest monthly performance since April as rates sold off after an impressive employment report in early October and firmer than expected inflation data. Market participants reassessed both the pace and magnitude of upcoming Federal Reserve rate cuts. For the high yield bond market, duration-driven price declines were partially offset by spread tightening as the strong economic backdrop has proven favorable for risk assets.
High yield spreads continued to rally to new post-Great Financial Crisis lows after the election. However, the financing surplus1 continues to be a supportive backdrop for high yield. There has been a persistent positive financing surplus of the U.S. non-financial corporate sector since 2020. A positive financing surplus means that the corporate sector is saving, so there is no need to raise new funding. This savings means reductions in net debt as companies increase cash balances, thus helping support high yield valuations. With the backup in yields across the asset class and new issuance continuing to be suppressed, this could serve as an attractive entry point for total return investors despite tight spread valuations.
— Eric Williams, Head of Capital Structure, Global Fixed Income
HIGH YIELD FUTURE FINANCING
There has been a persistent positive financing surplus of the U.S. non-financial corporate sector since 2020.

Source: Northern Trust Asset Management, Federal Reserve, J.P. Morgan. Quarterly data from 12/31/1951 through 6/30/2024. The financing surplus1 is proxied by the difference between corporate cash flows and capex as a percentage of U.S. GDP. Historical trends are not predictive of future results.
- A positive financing surplus means that the corporate sector is saving, so there is no need to raise new funding.
- This saving means reductions in net debt as companies increase cash balances, thus helping support high yield valuations.
- With the backup in yields across the asset class and new issuance continuing to be suppressed, this could serve as an attractive entry point.
Equities
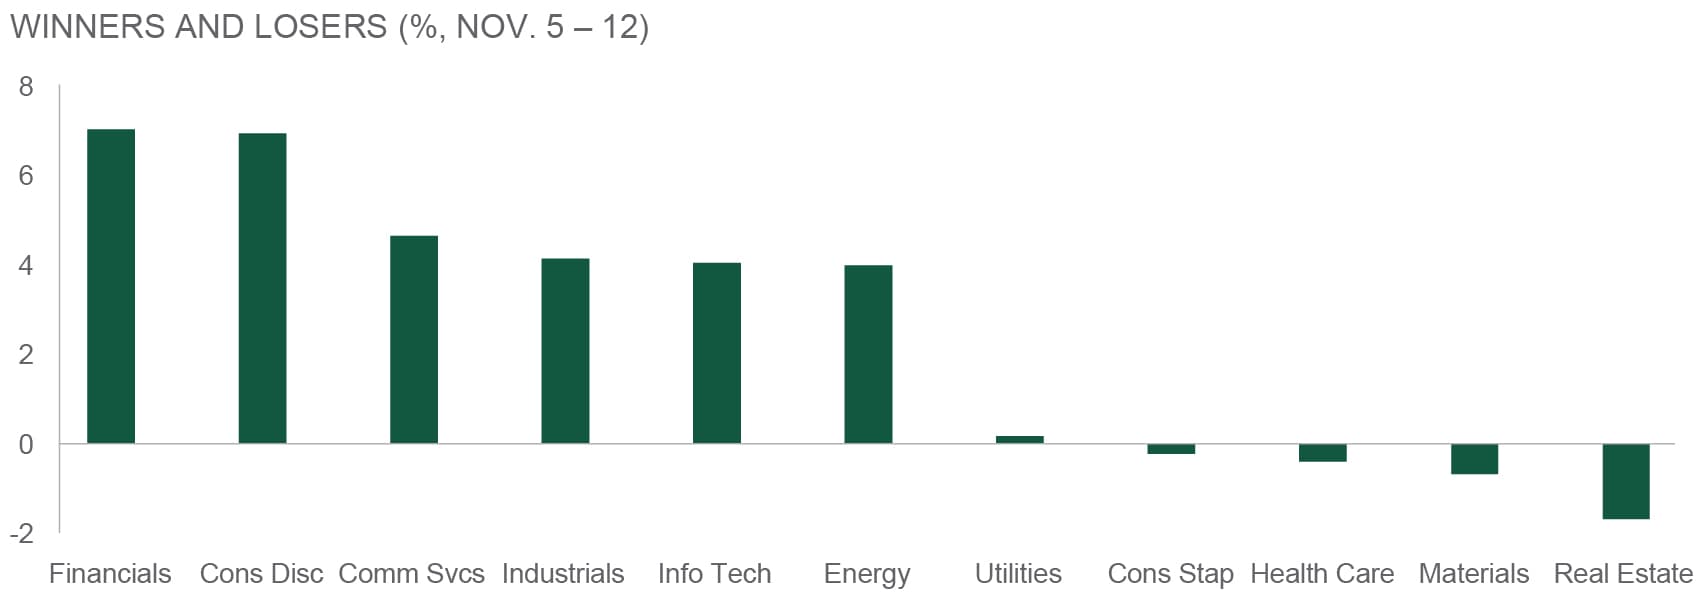
U.S. large caps were range bound in October, finishing down -0.7% and ending a 5-month winning streak. Volatility stayed elevated heading into the election on November 5. However, following a convincing Republican win of the White House and Senate, markets shot higher and volatility dropped precipitously with the 1 sinking 7 points in the week following the election. Broadly speaking, the day after the election, the relative winners and losers were thematically aligned with an unwinding of hedges, along with an anticipation of Trump policy initiatives. Despite some reversion in subsequent trading sessions, these gains have largely held.
With election uncertainty resolved, uncertainty around the net effect of Trump policies comes to the fore. Weighing policy implications, strong expected earnings growth over the next two years, and a likelihood of further rate cuts from the Fed, we maintain our overweight to equities. We believe the incoming administration’s policy initiatives raise the odds of U.S. outperformance, especially versus Europe. Therefore, we increased our overweight to the U.S., and moved to underweight from neutral in Developed ex-U.S.
— Jordan Dekhayser, Head of Equity Client Portfolio Management
The Cboe Volatility Index (VIX Index) measures investors' consensus view of future expected volatility of the stock market as represented by the S&P 500 Index.
REPUBLICAN ELECTION SWEEP WINNERS AND LOSERS
The immediate election aftermath was consistent with Trump policy initiatives.

Source: Northern Trust Asset Management, FactSet, MSCI. Total return data for MSCI USA sectors from 11/5/2024 through 11/12/2024. VIX1 = CBOE Volatility Index. Past performance is not indicative or a guarantee of future results. Index performance returns do not reflect any management fees, transaction costs or expenses. It is not possible to invest directly in any index.
- The initial market reaction to election results was largely consistent with Trump policy initiatives.
- Potential policy initiatives raise the odds of U.S. outperformance over Developed ex-U.S. equities.
- We added to our U.S. equity overweight and initiated an underweight to Developed ex-U.S
Real Assets
In 2023 and 2024, the most substantial U.S. apartment construction surge in 40 years flooded the market. With this supply, apartment owners have had to contend with higher vacancies and lower asking rents, particularly in Southeast markets. We have also seen residential REIT earnings growth pushed out further into 2025.
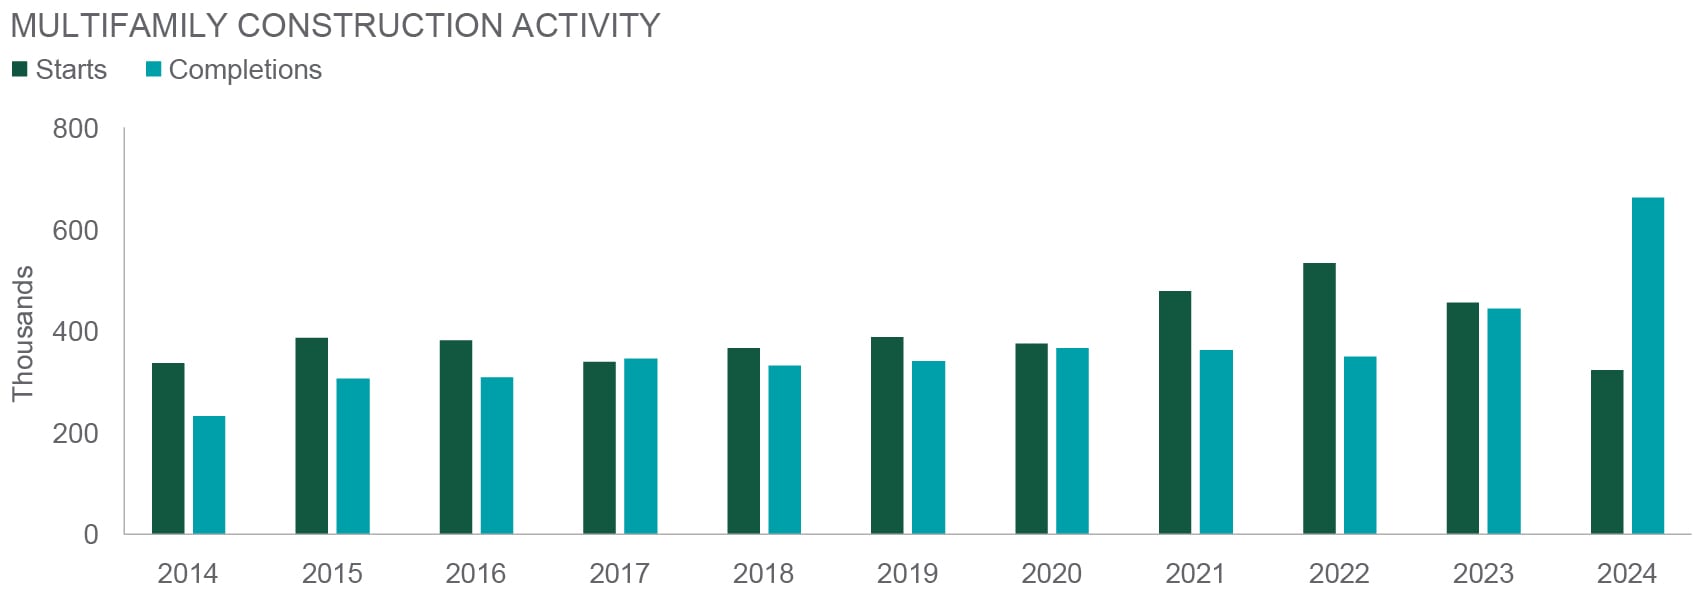
Yet, as we approach the end of 2024, it appears that pressures on the sector are abating. The national vacancy rate has stopped rising for the first time in two years and demand for apartments rose to its highest levels since 2021. This has occurred in part due to higher mortgage rates and single-family affordability issues. Renting is simply more attractive than home ownership in this environment. Along with higher completions and peaking vacancies, we have also seen starts drop dramatically over the last 12 months. With permit lead times, there is significant transparency into this pipeline and this a trend that is expected to continue well into 2025 and 2026. We expect this to prompt higher occupancy levels, tighter market conditions, and stronger rental growth and provide strong tailwinds and earnings growth for apartment landlords over the intermediate term.
— Jim Hardman, Head of Real Assets, Multi-Manager Solutions
EYE OF THE STORM
With two months left in 2024, multifamily completions have already hit 35-year highs in 2024.

Source: Northern Trust Asset Management, Census Bureau. Annual data from 12/31/2013 through 10/31/2024. Historical trends are not predictive of future results.
- U.S. apartment fundamentals have been challenged, but we expect a slowdown in starts to provide strong tailwinds and significant earnings growth in the intermediate term.
- We view real estate as a portfolio diversifier and a way to protect against inflation.
- We remain neutral overall with a 2% underweight to Natural Resources and 1% overweight to both Global Real Estate and Listed Infrastructure.
Real assets include real estate (such as commercial offices), infrastructure (airports) and natural resources (metals). Investors value them as portfolio diversifiers; their returns often don't correlate with stocks and bonds.


Source: Northern Trust Capital Market Assumptions Working Group, Investment Policy Committee. Strategic allocation is based on capital market return, risk and correlation assumptions developed annually; most recent model released 8/9/2023.The model cannot account for the impact that economic, market and other factors may have on the implementation and ongoing management of an actual investment strategy. Asset allocation does not guarantee a profit or protection against a loss in declining markets. GLI = Global Listed Infrastructure, GRE = Global Real Estate, NR = Natural Resources.
Unless noted otherwise, data on this page is sourced from Bloomberg as of November 2024.
Main Point
Uncovering Opportunities in U.S. Markets
U.S. markets are positioned for potential growth, driven by resilient fundamentals and evolving policies. From equities to high yield bonds, discover why diversification and inflation protection strategies may be essential in today’s dynamic environment.

Contact Us
Interested in learning more about our expertise and how we can help?
IMPORTANT INFORMATION
This content may not be edited, altered, revised, paraphrased, or otherwise modified without the prior written permission of Northern Trust Asset Management (NTAM). The information contained herein is intended for use with current or prospective clients of Northern Trust Investments, Inc (NTI) or its affiliates. The information is not intended for distribution or use by any person in any jurisdiction where such distribution would be contrary to local law or regulation. NTAM and its affiliates may have positions in and may effect transactions in the markets, contracts and related investments different than described in this information. This information is obtained from sources believed to be reliable, its accuracy and completeness are not guaranteed, and is subject to change. Information does not constitute a recommendation of any investment strategy, is not intended as investment advice and does not take into account all the circumstances of each investor.
This report is provided for informational purposes only and is not intended to be, and should not be construed as, an offer, solicitation or recommendation with respect to any transaction and should not be treated as legal advice, investment advice or tax advice. Recipients should not rely upon this information as a substitute for obtaining specific legal or tax advice from their own professional legal or tax advisors. References to specific securities and their issuers are for illustrative purposes only and are not intended and should not be interpreted as recommendations to purchase or sell such securities. Indices and trademarks are the property of their respective owners. Information is subject to change based on market or other conditions.
All securities investing and trading activities risk the loss of capital. Each portfolio is subject to substantial risks including market risks, strategy risks, advisor risk, and risks with respect to its investment in other structures. There can be no assurance that any portfolio investment objectives will be achieved, or that any investment will achieve profits or avoid incurring substantial losses. No investment strategy or risk management technique can guarantee returns or eliminate risk in any market environment. Risk controls and models do not promise any level of performance or guarantee against loss of principal. Any discussion of risk management is intended to describe NTAM’s efforts to monitor and manage risk but does not imply low risk.
Past performance is not a guarantee of future results. Performance returns and the principal value of an investment will fluctuate. Performance returns contained herein are subject to revision by NTAM. Comparative indices shown are provided as an indication of the performance of a particular segment of the capital markets and/or alternative strategies in general. Index performance returns do not reflect any management fees, transaction costs or expenses. It is not possible to invest directly in any index. Net performance returns are reduced by investment management fees and other expenses relating to the management of the account. Gross performance returns contained herein include reinvestment of dividends and other earnings, transaction costs, and all fees and expenses other than investment management fees, unless indicated otherwise. For additional information on fees, please refer to Part 2a of the Form ADV or consult an NTI representative.
Forward-looking statements and assumptions are NTAM’s current estimates or expectations of future events or future results based upon proprietary research and should not be construed as an estimate or promise of results that a portfolio may achieve. Actual results could differ materially from the results indicated by this information.
This information is intended for purposes of NTI and/or its affiliates marketing as providers of the products and services described herein and not to provide any fiduciary investment advice within the meaning of Section 3(21) of the Employee Retirement Income Security Act of 1974, as amended (ERISA). NTI and/or its affiliates are not undertaking to provide a recommendation or give investment advice in a fiduciary capacity to the recipient of these materials, which are for marketing purposes and are not intended to serve as a primary basis for investment decisions. NTI and/or its affiliates may receive fees and other compensation in connection with the products and services described herein as well as for custody, fund administration, transfer agent, investment operations outsourcing, and other services rendered to various proprietary and third-party investment products and firms that may be the subject of or become associated with the services described herein.
Northern Trust Asset Management is composed of Northern Trust Investments, Inc. Northern Trust Global Investments Limited, Northern Trust Fund Managers (Ireland) Limited, Northern Trust Global Investments Japan, K.K, NT Global Advisors, Inc., 50 South Capital Advisors, LLC, Northern Trust Asset Management Australia Pty Ltd, and investment personnel of The Northern Trust Company of Hong Kong Limited and The Northern Trust Company.
Not FDIC insured | May lose value | No bank guarantee