Research
- Who We Serve
- What We Do
- About Us
- Insights & Research
- Who We Serve
- What We Do
- About Us
- Insights & Research
Investment Perspective · 11.26.25
Save to bookmarks
Bubble Talk
How elevated valuations and concentrated gains shape today’s market outlook, why fundamentals differ from the dot-com era, and what investors should watch heading into 2026.
- Equity Insights
- Portfolio Construction
- Markets & Economy
- Volatility & Risk
Format
Change Format: Choose the format you prefer, and we'll remember your preference next time.
Bubble Talk
Save to bookmarks
Save to bookmarks
Key Points
What it is
We consider the equity markets’ record highs and whether it’s nearing bubble territory.
Why it matters
Comparisons to the dot-com era bring skepticism that the rally will last.
Where it's going
We maintain a cautiously optimistic outlook on the market and expect that earnings growth will support future returns.
Equity markets reached new record highs over the past month, reigniting debate over whether we’re in bubble territory. Heightened U.S. equity valuations and concentrated market leadership fuel this concern — but context matters. Markets rarely move in straight lines, and short-term pullbacks, while uncomfortable, are a normal part of the cycle.
The and other major valuation metrics point to expensive U.S. equity market conditions relative to both history and global peers. Yet valuation alone is a poor timing tool; expensive markets can stay that way for a long time. We believe valuation is a better guide for long-term return expectations than short-term tactical positioning.
Comparisons to the late-1990s tech bubble often miss a critical point: today’s market leaders are fundamentally stronger. While technology’s index weight is above that era, so is its earnings contribution. Current mega-cap firms boast strong profits and free cash flow with business models grounded in recurring revenue streams and global scale — a different foundation than the speculative optimism that held up valuations in the dot-com era. Still, concentration risk should not be ignored. The top ten stocks in the U.S. have driven around 60% of this year’s gains.
Encouragingly, forecasts suggest profit growth will continue to broaden beyond these giants in 2026. Bull markets usually don’t end because they’ve aged; they need a catalyst — such as tight policy or a deterioration in earnings momentum. By historical measures, this rally could still be mid-cycle.
In our view, equity market gains have been underpinned by healthy fundamentals. We maintain a cautiously optimistic outlook, as we expect that earnings growth will support future returns. To be sure, there are several risks, such as continued labor market deterioration, expanding government and corporate debt levels, hawkish policy shifts, and high expectations around artificial intelligence. While risks don’t negate the bigger picture, they certainly warrant ongoing analysis. For now, we retain a tactical risk-on tilt with a preference for equities over fixed income.
INCREASING WEIGHT, INCREASING EARNINGS
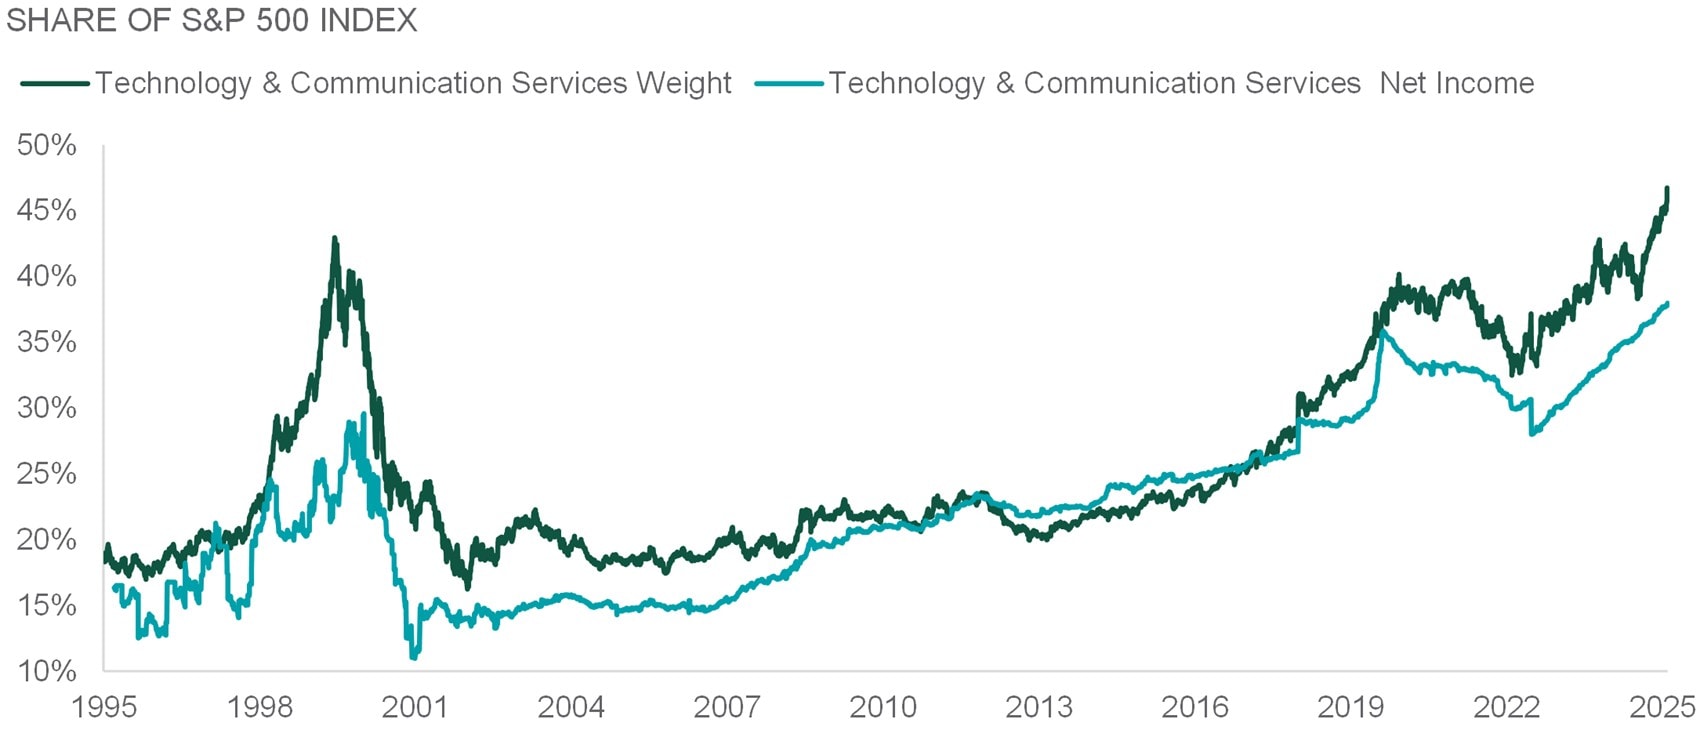
Source: Northern Trust Asset Management, FactSet. Weight is by market capitalization and net income is 12-month forward net income. Data from September 1995 through October 2025. Historical trends are not predictive of future results.
Interest Rates
We’ve been monitoring repo and money market conditions for signs of stress, and signals that (QT, or balance sheet reduction) may be coming to an end. Earlier in October, Chair Powell commented on upward pressure on repo rates, prompting speculation that QT may end imminently. Ultimately, the Fed announced that QT will end December 1st. It became clear to policymakers and market strategists that we had reached the tipping point between “abundant” and “ample” reserves.
While repo rates have been trading near, and even above, the top end of the target range, we haven’t seen signs of spill over into other markets or asset classes, including . Financing has become more expensive for most repo market participants, with some opting to tap the Fed’s , but repo markets have continued to function. It’s plausible that repo rates continue to trade around the top of the target range even after QT ends. Adjustments to administered rates like Interest On excess Reserve Balances (IORB) or the SRF would likely bias money market rates lower within the target range. While QT is ending, there will continue to be plenty worth monitoring in money markets as we head into year end.
— Dan LaRocco, Head of U.S. Liquidity, Global Fixed Income
FROM ABUNDANT TO AMPLE
Repo rates have seen upward pressure.
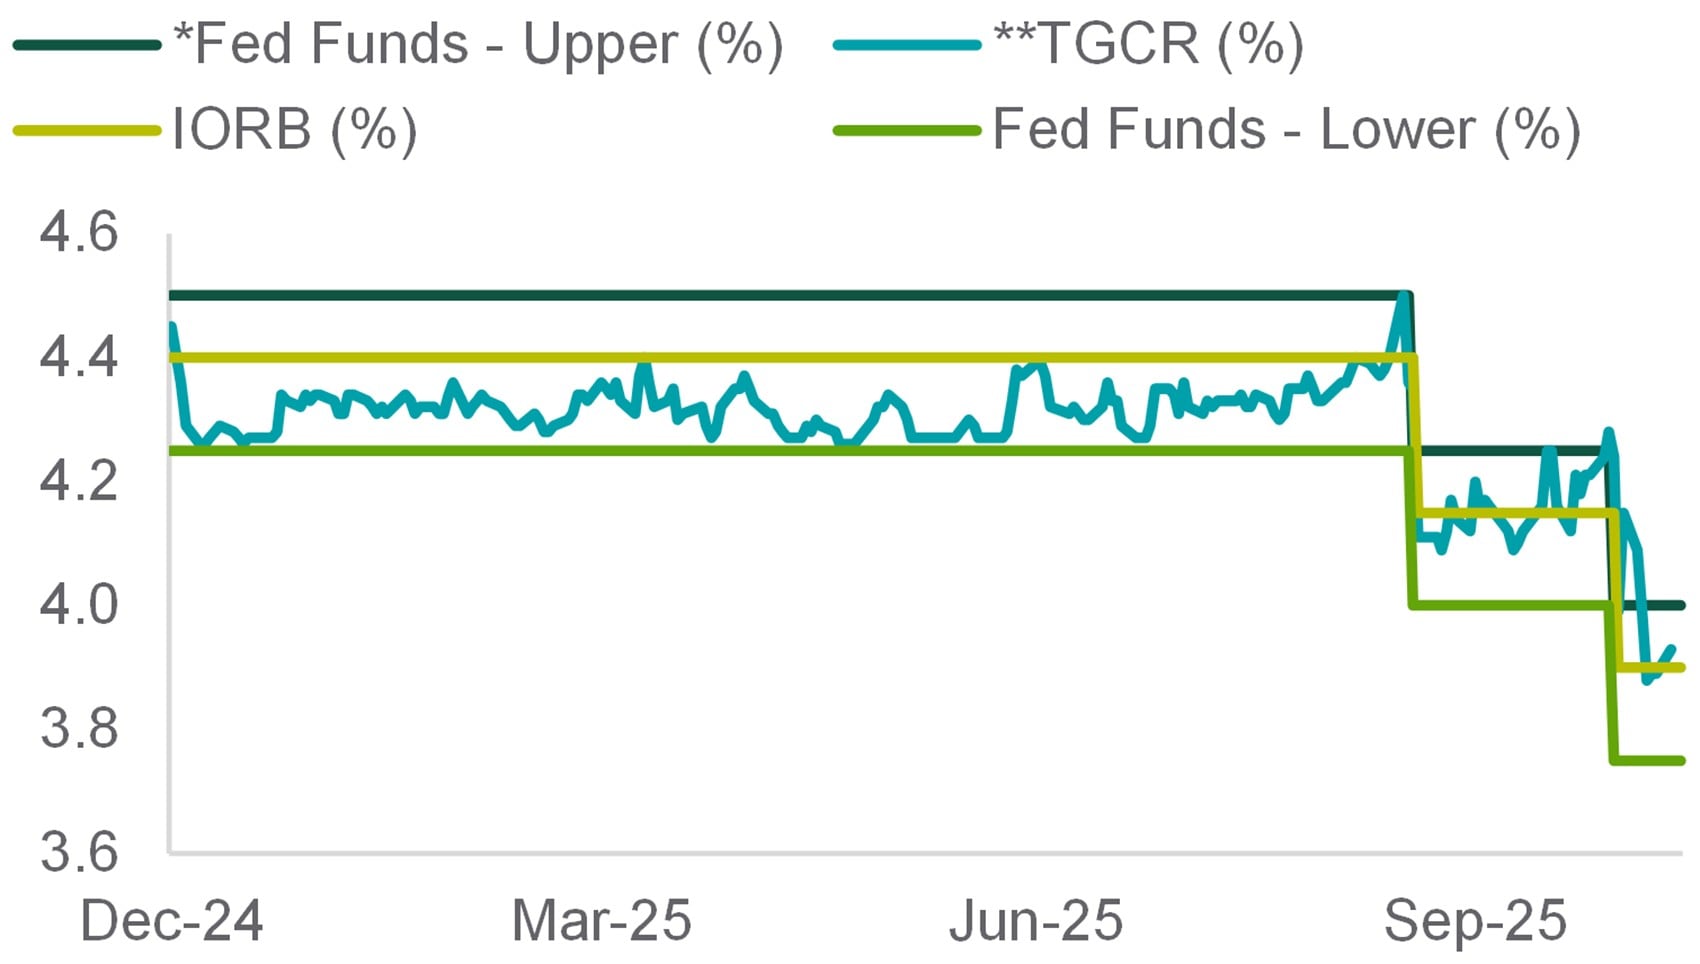
Source: Northern Trust Asset Management, Bloomberg. *Also the rate on Standing Repo Facility. TGCR = U.S. Tri-Party General Collateral Rate (**also a measure of repo rates); IORB = Interest On excess Reserve Balances. Data from 12/31/2024 through 11/12/2025. Historical trends are not predictive of future results.
- Quantitative tightening will end on December 1st, but repo rates may remain under pressure.
- This shouldn’t be mistaken for quantitative easing..
- Money market conditions will continue to be worth watching as we head into year end.
Credit Markets
October saw relatively subdued issuance activity in the high-yield market, but notable trends are emerging. One of the most significant is the rise in funding for AI-related capital expenditures. A handful of these transactions entered the high-yield space last month, reflecting the ongoing surge in demand for data centers and power infrastructure to support AI growth. The global buildout of data centers and AI capabilities is shaping up to be an extraordinary capital markets event, with estimated costs around $5 trillion. Financing this scale of investment will likely require participation from every corner of public markets, alongside private credit, alternative capital providers, and government support. The magnitude of these commitments carries implications for credit markets.
AI and data center development are likely to drive a re-acceleration of high yield market growth after shrinking post-COVID. While there is capacity for meaningful funding from high yield, the history of previous “new largest sector” episodes — such as telecom in the 1990s and energy from 2010–2015 — has been poor. These precedents deserve careful consideration as the sector evolves today.
— Ben McCubbin and Sau Mui, Co-Heads of High Yield
ALL HANDS ON DECK
Financing the AI buildout will require broad participation.
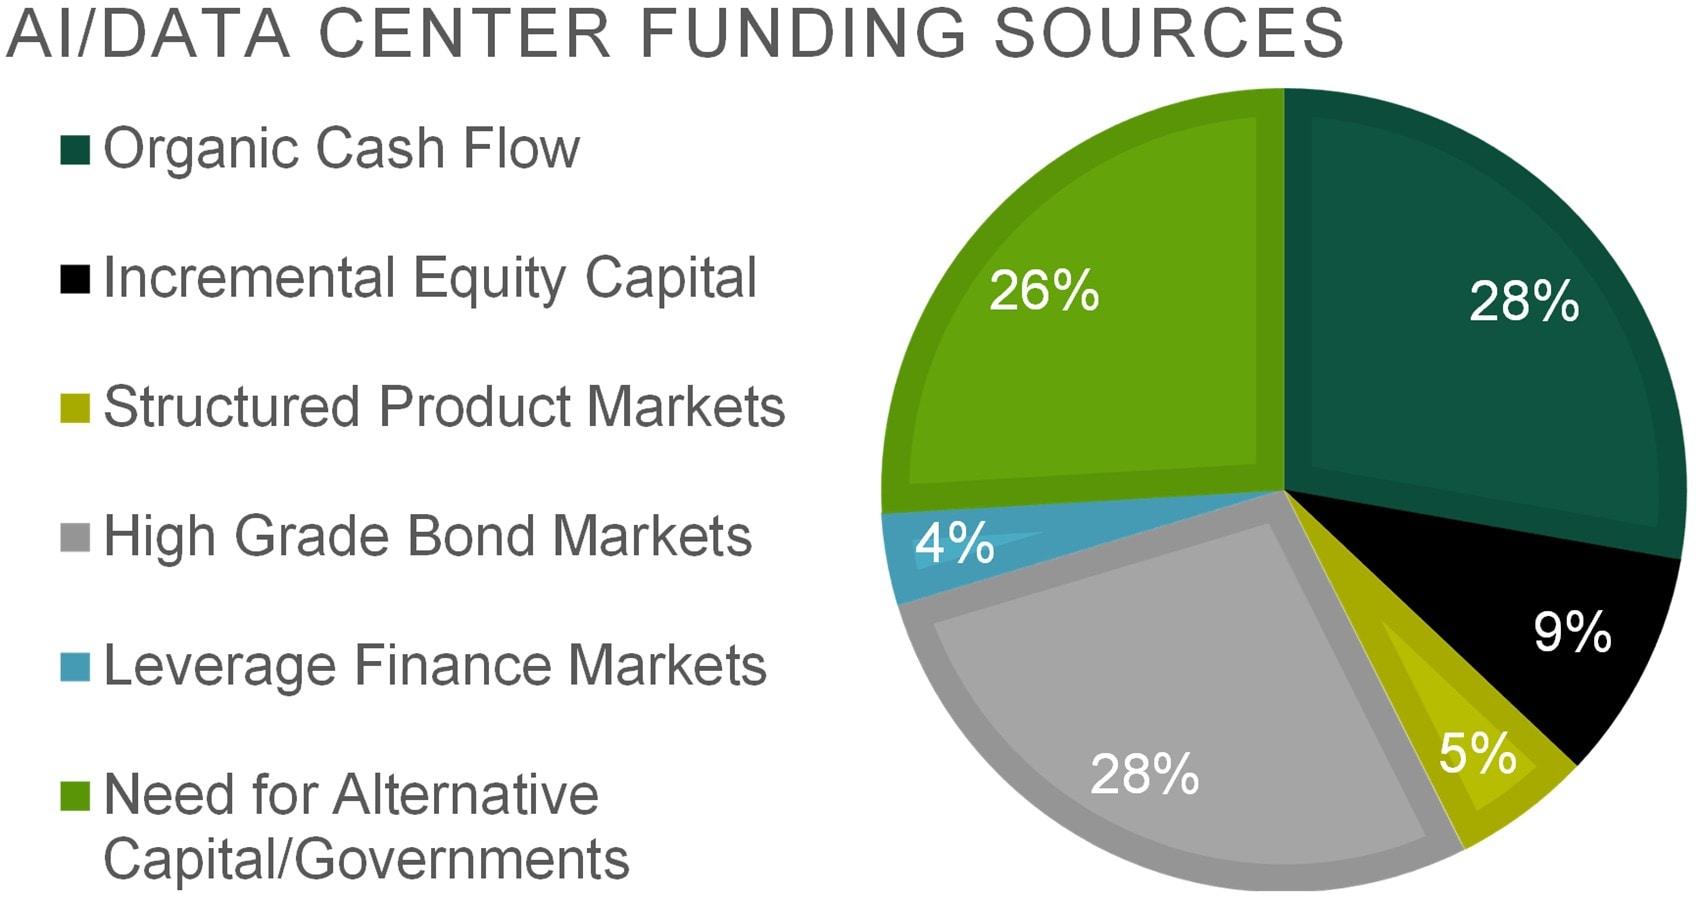
Source: J.P. Morgan estimates that assumes permanent financings. Data as of 10/31/2025.
- AI-related capital expenditures are driving new high-yield issuance.
- Financing the global AI buildout will involve public markets, private credit, and government support.
- The history of “the new largest sector” has been poor. Those episodes deserve careful consideration today.
Equities
Markets rallied in October after a sharp pullback early in the month as U.S.–China trade tensions flared. U.S. equities gained 2.4%, extending their rebound to 39% from April 8 post-Liberation Day lows. Developed markets ex-U.S. added 1.1%, while emerging markets rose 4.2%, led by tech heavyweights. Technology dominance deepened: in the U.S., the plus Broadcom now represent 39% of the S&P 500, nearly double their share at the end of 2022. Meanwhile, the again lagged its cap-weighted counterpart.
Resilience remains the main theme. Beyond trade issues, investors shook off the longest U.S. government shutdown and Fed Chair Powell’s comments on a December rate cut as “not a foregone conclusion.” Robust Q3 earnings comforted investors, with most AI darlings delivering and guiding higher. Following early-month volatility, the quickly retreated and remains near long-run averages. Macro and fundamental tailwinds continue to support equities. While valuations are elevated, strong earnings justify an overweight to risk assets. We maintain our preference for global equities more broadly.
— Jordan Dekhayser, Head of Equity Client Portfolio Management
A Global Rally
Resilience remains the main theme in 2025.
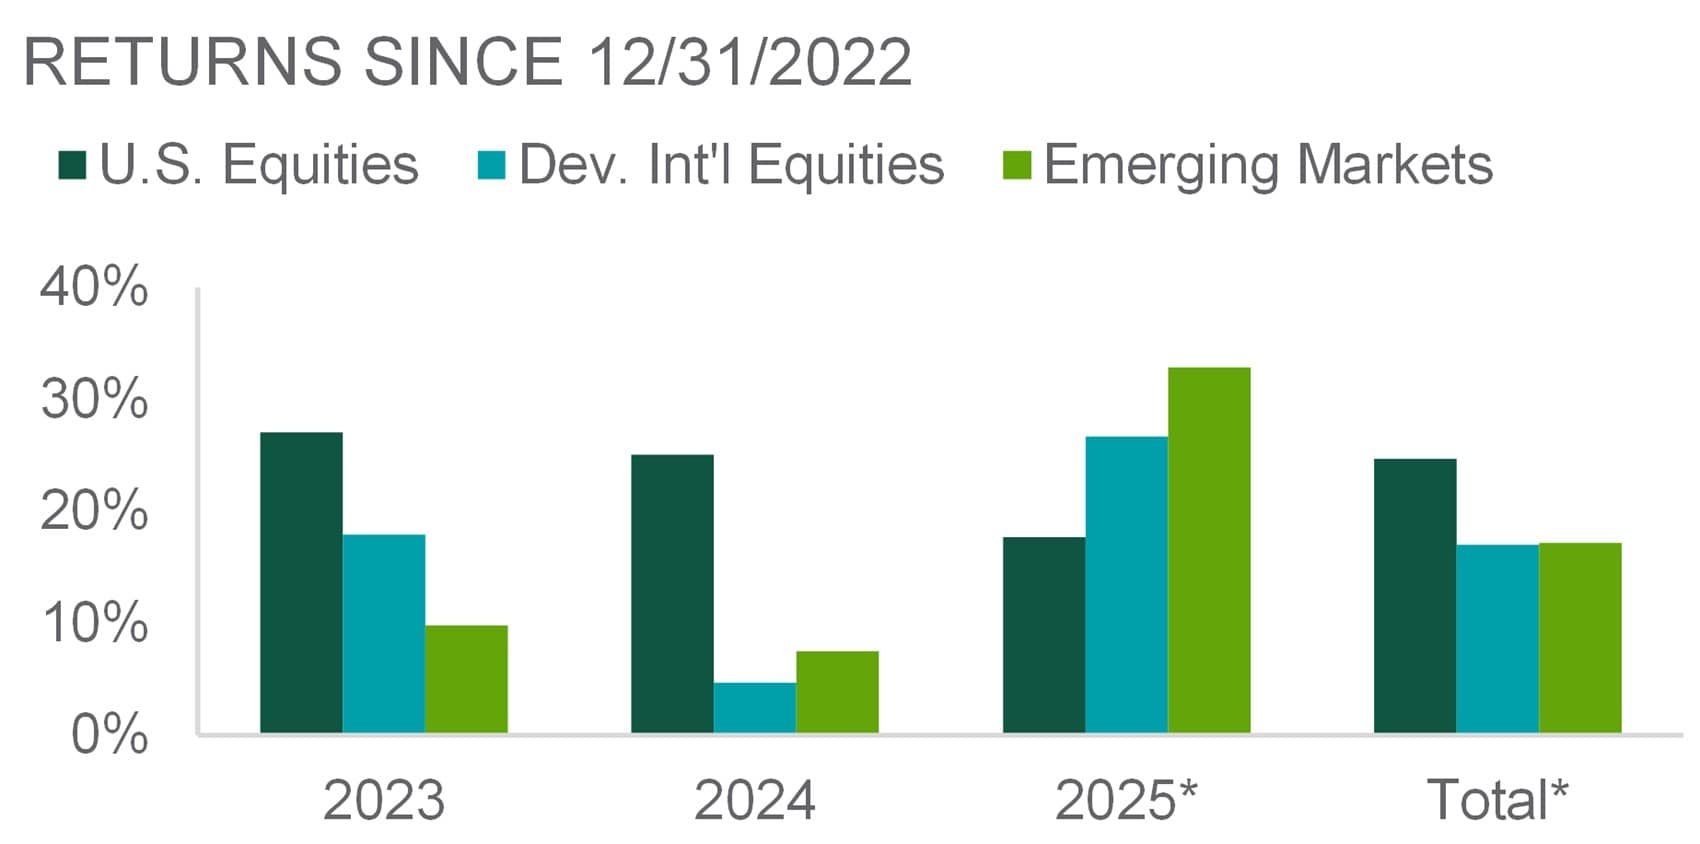
Source: Northern Trust Asset Management, MSCI. *2025 and total data are through 10/31/2025 (total is annualized). U.S., Dev. Int’l, and Emerging Markets are MSCI USA, MSCI World ex-U.S. and MSCI Emerging Markets, respectively. Past performance is not indicative or a guarantee of future results. Index performance returns do not reflect any management fees, transaction costs or expenses. It is not possible to invest directly in any index.
- Equities rebounded strongly after early volatility, with continued leadership from technology and AI themes.
- A resilient economy, lower recession risks, and strong corporate earnings have provided a solid foundation.
- We maintain a broad tactical overweight to global equities with no major regional preference.
Real Assets
Rental housing continues to play a vital role in the U.S. housing market. The national homeownership rate has averaged around 65%, peaking in 2004 before bottoming out in 2016. Today, we are hovering near that long-term average, and demographic trends — such as delayed household formation and affordability constraints — suggest that homeownership rates may remain rangebound for the foreseeable future.
The housing shortage is most acute among low-income households, where supply is constrained. In contrast, many markets still offer affordability for median-income earners. A key challenge in this supply gap is misalignment. Much of the new construction has focused on high-end units, leaving a gap in the development of affordable housing. This imbalance exacerbates accessibility issues for lower- and middle-income renters. The issue is not solely about increasing quantity — it’s about ensuring the right type of housing is available. Addressing these challenges requires a holistic and localized approach from policymakers, investors, and housing developers alike.
— Jim Hardman, Head of Real Assets, Multi-Manager Solutions
HOMEOWNERSHIP HICCUP
Rental housing remains a cornerstone of the resi-market.
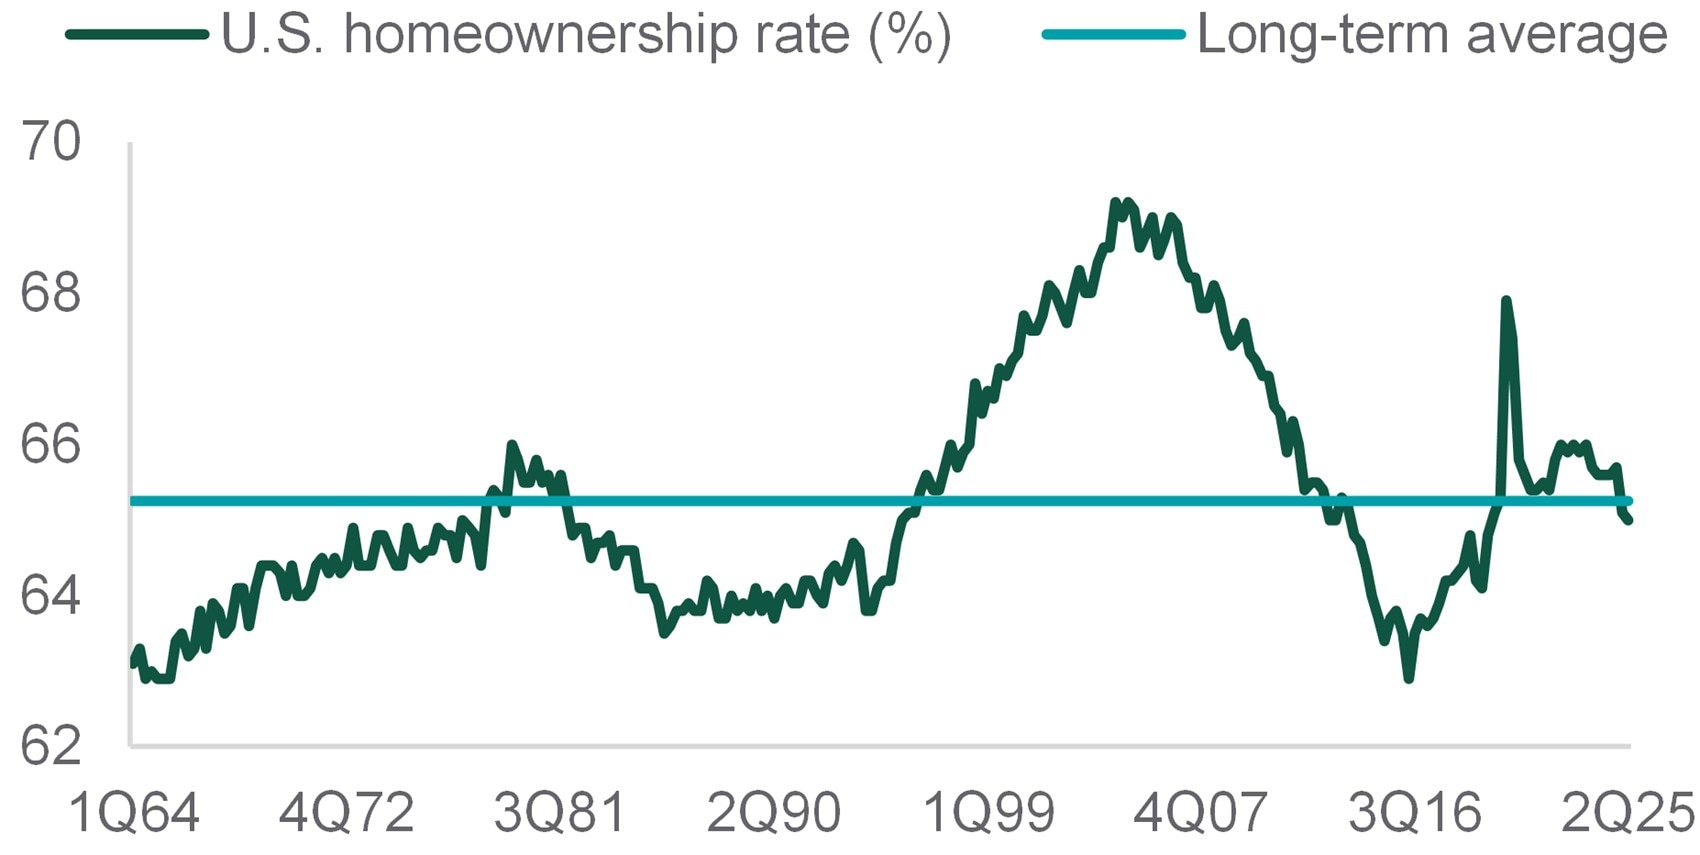
Source: Northern Trust Asset Management, U.S. Census Bureau. Data through the second quarter (2Q) of 2025. Historical trends are not predictive of future results.
- Homeownership appears rangebound from here, considering demographic trends, and expected supply and demand.
- Affordable housing development has lagged the luxury cohort.
- We reaffirm our overweight to global listed infrastructure and underweight to global real estate.
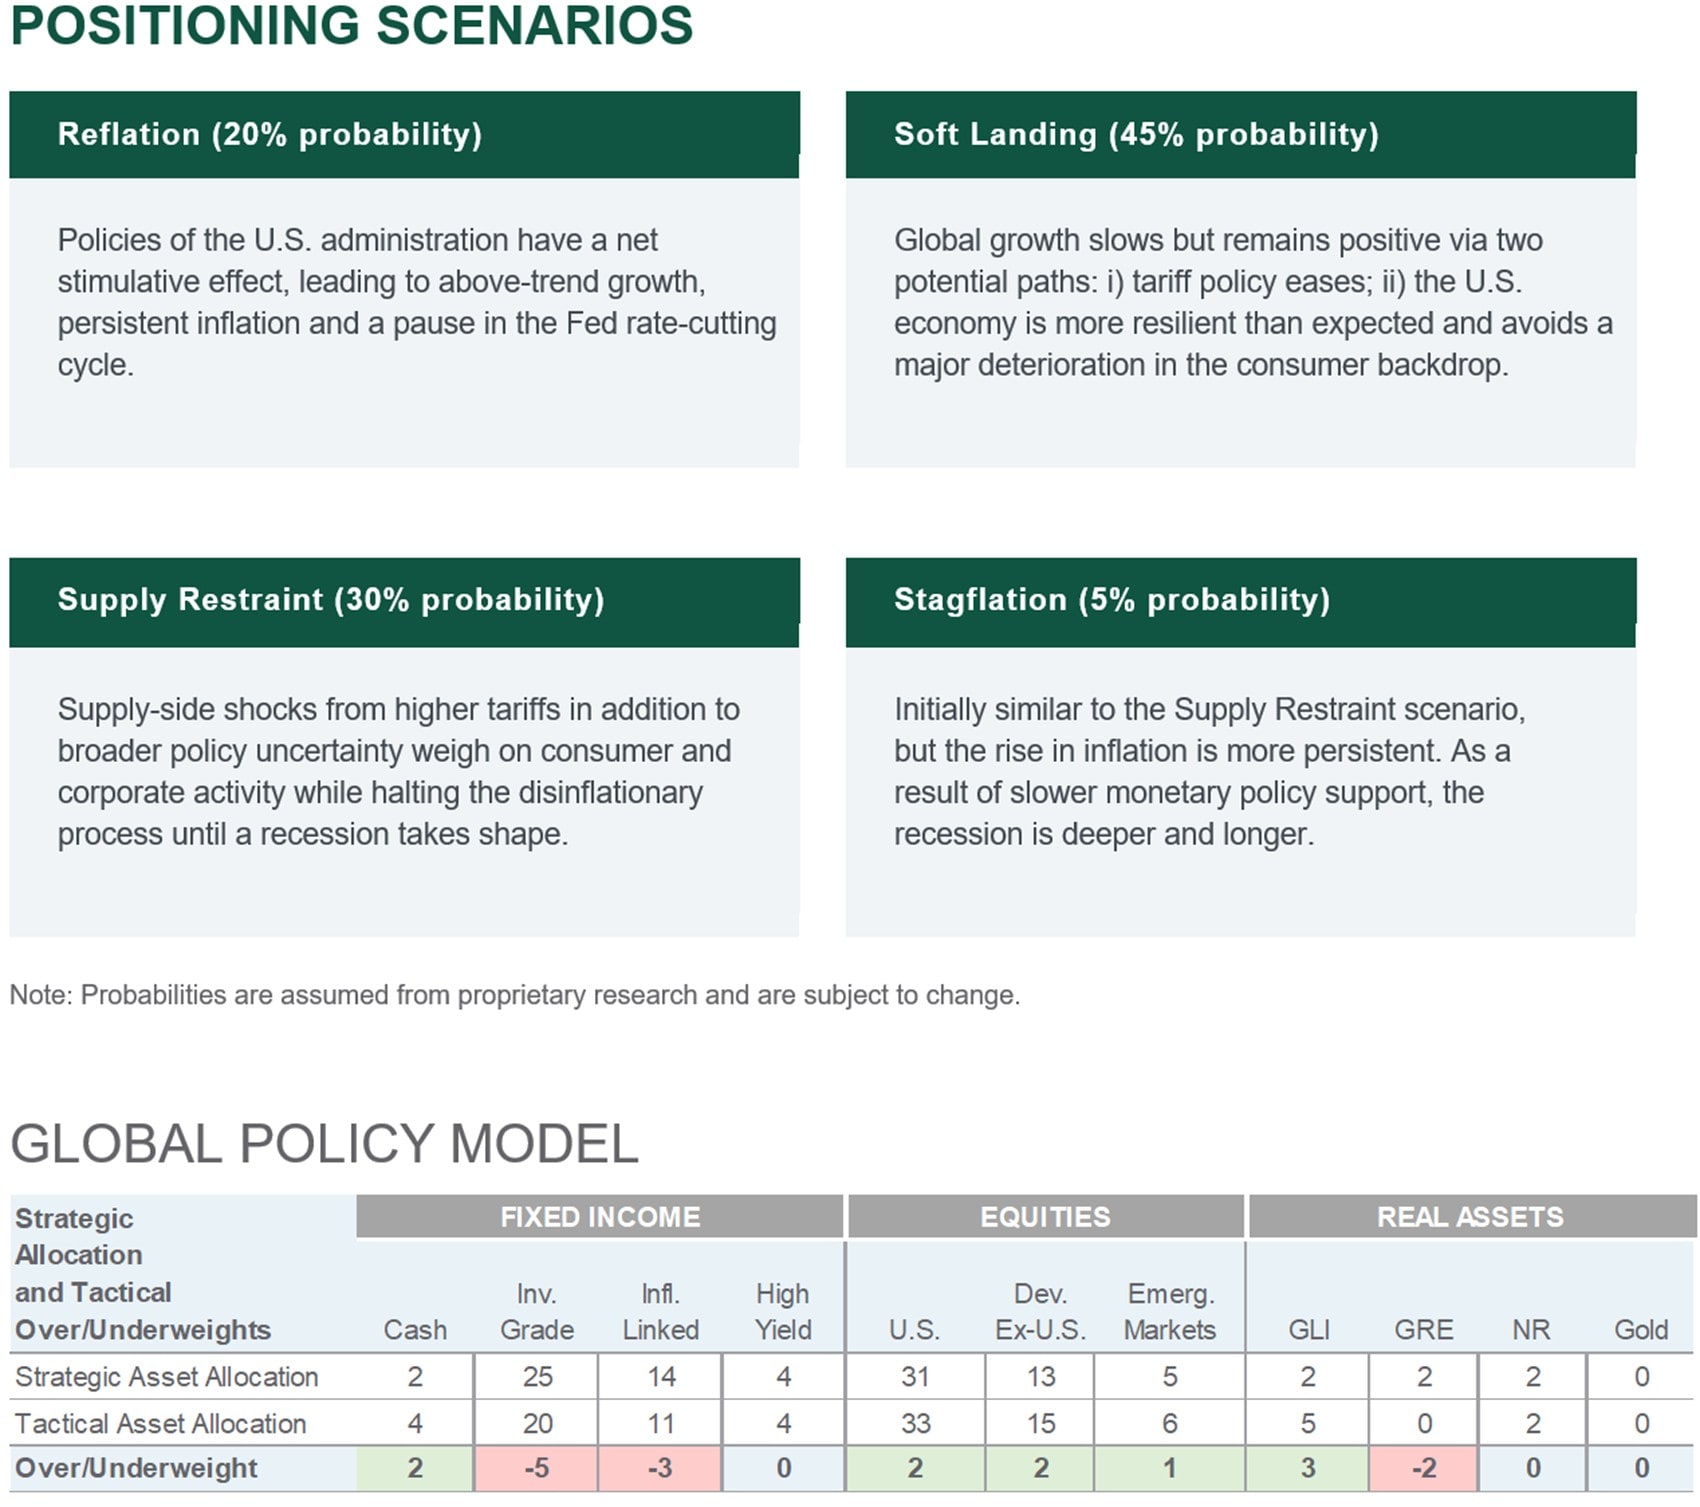
Source: Northern Trust Capital Market Assumptions Working Group, Investment Policy Committee. Strategic allocation is based on capital market return, risk and correlation assumptions developed annually; most recent model released 1/15/2025. The model cannot account for the impact that economic, market and other factors may have on the implementation and ongoing management of an actual investment strategy. Asset allocation does not guarantee a profit or protection against a loss in declining markets. GLI = Global Listed Infrastructure, GRE = Global Real Estate, NR = Natural Resources. Unless otherwise noted, the statements expressed herein are solely opinions of Northern Trust. Northern Trust does not make any representation, assurance, or other promise as to the accuracy, impact, or potential occurrence of any events or outcomes expressed in such opinions.
Unless noted otherwise, data is sourced from Bloomberg as of November 2025.
Main Point
Bubble Talk: Context Is Key
Record highs have reignited bubble fears, but today’s fundamentals differ from past eras. Strong earnings and healthy balance sheets suggest resilience — though risks remain. Context matters when assessing market outlook.

Contact Us
Interested in learning more about our expertise and how we can help?
IMPORTANT INFORMATION
The information contained herein is intended for use with current or prospective clients of Northern Trust Investments, Inc (NTI) or its affiliates. The information is not intended for distribution or use by any person in any jurisdiction where such distribution would be contrary to local law or regulation. Northern Trust Asset Management’s (NTAM) and its affiliates may have positions in and may effect transactions in the markets, contracts and related investments different than described in this information. This information is obtained from sources believed to be reliable, its accuracy and completeness are not guaranteed, and is subject to change. Information does not constitute a recommendation of any investment strategy, is not intended as investment advice and does not take into account all the circumstances of each investor.
This information is provided for informational purposes only and is not intended to be, and should not be construed as, an offer, solicitation or recommendation with respect to any transaction and should not be treated as legal advice, investment advice or tax advice. Recipients should not rely upon this information as a substitute for obtaining specific legal or tax advice from their own professional legal or tax advisors. References to specific securities and their issuers are for illustrative purposes only and are not intended and should not be interpreted as recommendations to purchase or sell such securities. Indices and trademarks are the property of their respective owners. Information is subject to change based on market or other conditions.
All securities investing and trading activities risk the loss of capital. Each portfolio is subject to substantial risks including market risks, strategy risks, advisor risk, and risks with respect to its investment in other structures. There can be no assurance that any portfolio investment objectives will be achieved, or that any investment will achieve profits or avoid incurring substantial losses. No investment strategy or risk management technique can guarantee returns or eliminate risk in any market environment. Risk controls and models do not promise any level of performance or guarantee against loss of principal. Any discussion of risk management is intended to describe NTAM’s efforts to monitor and manage risk but does not imply low risk.
Past performance is not a guarantee of future results. Performance returns and the principal value of an investment will fluctuate. Performance returns contained herein are subject to revision by NTAM. Comparative indices shown are provided as an indication of the performance of a particular segment of the capital markets and/or alternative strategies in general. Index performance returns do not reflect any management fees, transaction costs or expenses. It is not possible to invest directly in any index. Net performance returns are reduced by investment management fees and other expenses relating to the management of the account. Gross performance returns contained herein include reinvestment of dividends and other earnings, transaction costs, and all fees and expenses other than investment management fees, unless indicated otherwise. For U.S. NTI prospects or clients, please refer to Part 2a of the Form ADV or consult an NTI representative for additional information on fees.
Forward-looking statements and assumptions are NTAM’s current estimates or expectations of future events or future results based upon proprietary research and should not be construed as an estimate or promise of results that a portfolio may achieve. Actual results could differ materially from the results indicated by this information. Historical trends are not predictive of future results.
Northern Trust Asset Management is composed of Northern Trust Investments, Inc., Northern Trust Global Investments Limited, Northern Trust Fund Managers (Ireland) Limited, Northern Trust Global Investments Japan, K.K., NT Global Advisors, Inc., 50 South Capital Advisors, LLC, Northern Trust Asset Management Australia Pty Ltd, and investment personnel of The Northern Trust Company of Hong Kong Limited and The Northern Trust Company.
Not FDIC insured | May lose value | No bank guarantee