Investment Perspective
- Who We Serve
- What We Do
- About Us
- Insights & Research
- Who We Serve
- What We Do
- About Us
- Insights & Research
Investment Perspective · 01.26.26
Save to bookmarks
When More Means Less: Navigating The Risks of a U.S. Productivity Boom
A sharp productivity jump shows firms doing more with fewer workers. But the upside surprise also highlights growing risks about how these gains affect the workforce.
- Portfolio Construction
- Volatility & Risk
- Multi-Asset Insights
- Markets & Economy
Format
Change Format: Choose the format you prefer, and we'll remember your preference next time.
When More Means Less: Navigating The Risks of a U.S. Productivity Boom
Save to bookmarks
Save to bookmarks
Key Points
What it is
U.S. productivity is rising faster than expected, while hiring remains subdued as firms do more with fewer workers.
Why it matters
Tech‑driven efficiency gains could push productivity toward late‑1990s levels but may deepen divides in how workers benefit.
Where it's going
If efficiency gains don’t translate into stronger hiring and wage growth, the U.S. risks a jobless recovery with widening inequality and dampened consumer demand.
The latest U.S. productivity numbers have delivered an unexpected jolt. 3Q data revealed a large upside surprise, with output per hour rising above expectations. In theory, this should be great news: firms are doing more with less, a marker of economic vitality. Yet, the reality is more complex — and potentially troubling for the U.S. workforce.
Recent Trends. The U.S. corporate sector is achieving more with fewer hands. Even as productivity rises, hiring remains subdued. This divergence signals that businesses are squeezing greater efficiencies from existing resources, rather than expanding payrolls. With labor markets already showing signs of slack, the question arises: are we witnessing the birth of a new era of “lean growth”?
Historical Perspective: From Slow Lane to Fast Track. Since the financial crisis, U.S. productivity growth has averaged a modest 1.5% annually. Over the past five years, that figure has crept up to around 2% — a clear improvement, but one that still lags the heady days of the late 1990s. Back then, tech-driven gains propelled productivity growth to 3-4%, fundamentally reshaping the economic landscape. Today, rapid advances in AI and automation hint at a possible return to those heights. The question is whether the broader economy — and its workers — are prepared for the consequences.
Tech’s Role: A Double-Edged Sword. The tech sector remains the engine of productivity acceleration. Machine learning, robotics, and cloud computing innovations are enabling firms to amplify output with labor costs steady or even lower. If this persists, 3-4% annual productivity growth could become the new normal. But history suggests that such booms are rarely unalloyed blessings. The late 1990s saw robust job creation; today, the same forces may instead reinforce labor market bifurcation.
Labor Market Implications: The Unit Cost Conundrum. Rising productivity, coupled with constrained wage gains, is driving down unit labor costs. This is good news for profit margins, but less so for workers whose wages lag behind. The real test will be whether these efficiency gains translate into broad-based employment growth. If not, the U.S. risks a “tepid recovery,” with profits outpacing wage growth by up to fourfold — a scenario that could exacerbate inequality and dampen consumer demand.
Key Question: Can Productivity Power Job Growth? Productivity sets the speed limit for the economy. Sustained upside surprises are welcome, provided they are matched by robust job creation and rising incomes. If, however, the current trajectory persists — where firms grow more efficient without expanding their workforce — the U.S. may find itself in a jobless recovery, where the spoils of growth accrue disproportionately to capital over labor.
We introduced a new macro scenario to our outlook, in which tax cuts and deregulation more than offset the effects of tariffs and tighter immigration policies. In this environment, robust productivity gains persist, supporting strong economic growth without triggering higher inflation.
— Peter Wilke, CFA – Head of Tactical Asset Allocation, Global Asset Allocation
Rising U.S. Productivity
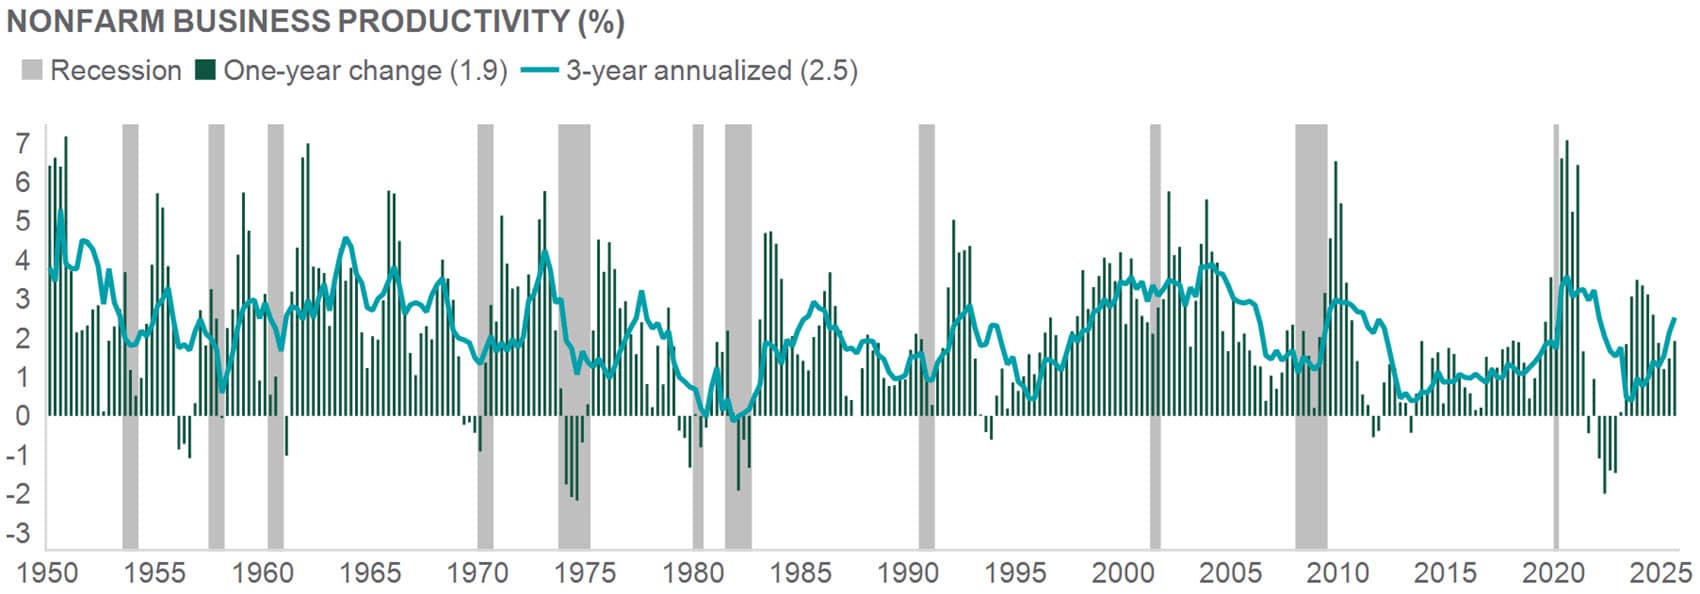
Source: Northern Trust Asset Management, Macrobond, U.S. Bureau of Labor Statistics (BLS), NBER (National Bureau of Economic Research). Data through 2025 Q3. Historical trends are not predictive of future results.
Interest Rates
There are three main items we are watching in the rates markets heading into 2026:
- Federal Open Market Committee (FOMC) pricing. While the year has started with many notable headlines and data points, pricing in futures markets for the expected path of monetary policy this year hasn’t changed much. Cuts are simply priced later in the year, still broadly aligned with our outlook. Markets expect two 25-basis-point cuts — slightly above the FOMC median but in line with our view.
- Rates volatility, or lack thereof? At the end of the third quarter last year we wrote about volatility in the long end of yield curves globally; the fourth quarter, excluding Japan, was far quieter, with yields largely rangebound into early 2026. Expectations for 2026 policy rates cluster tightly, but the path of term premiums remains unclear.
- Issuance. Nominal Treasury coupon issuance has been stable lately, and the Treasury Department has guided that it will remain so, but markets will stay focused on any signs of change. Bill issuance is in a normal first‑quarter upswing and will be watched closely, along with demand from the Fed’s reserve management purchases and other buyers.
— Dan LaRocco, Head of U.S. Liquidity, Global Fixed Income
Rangebound
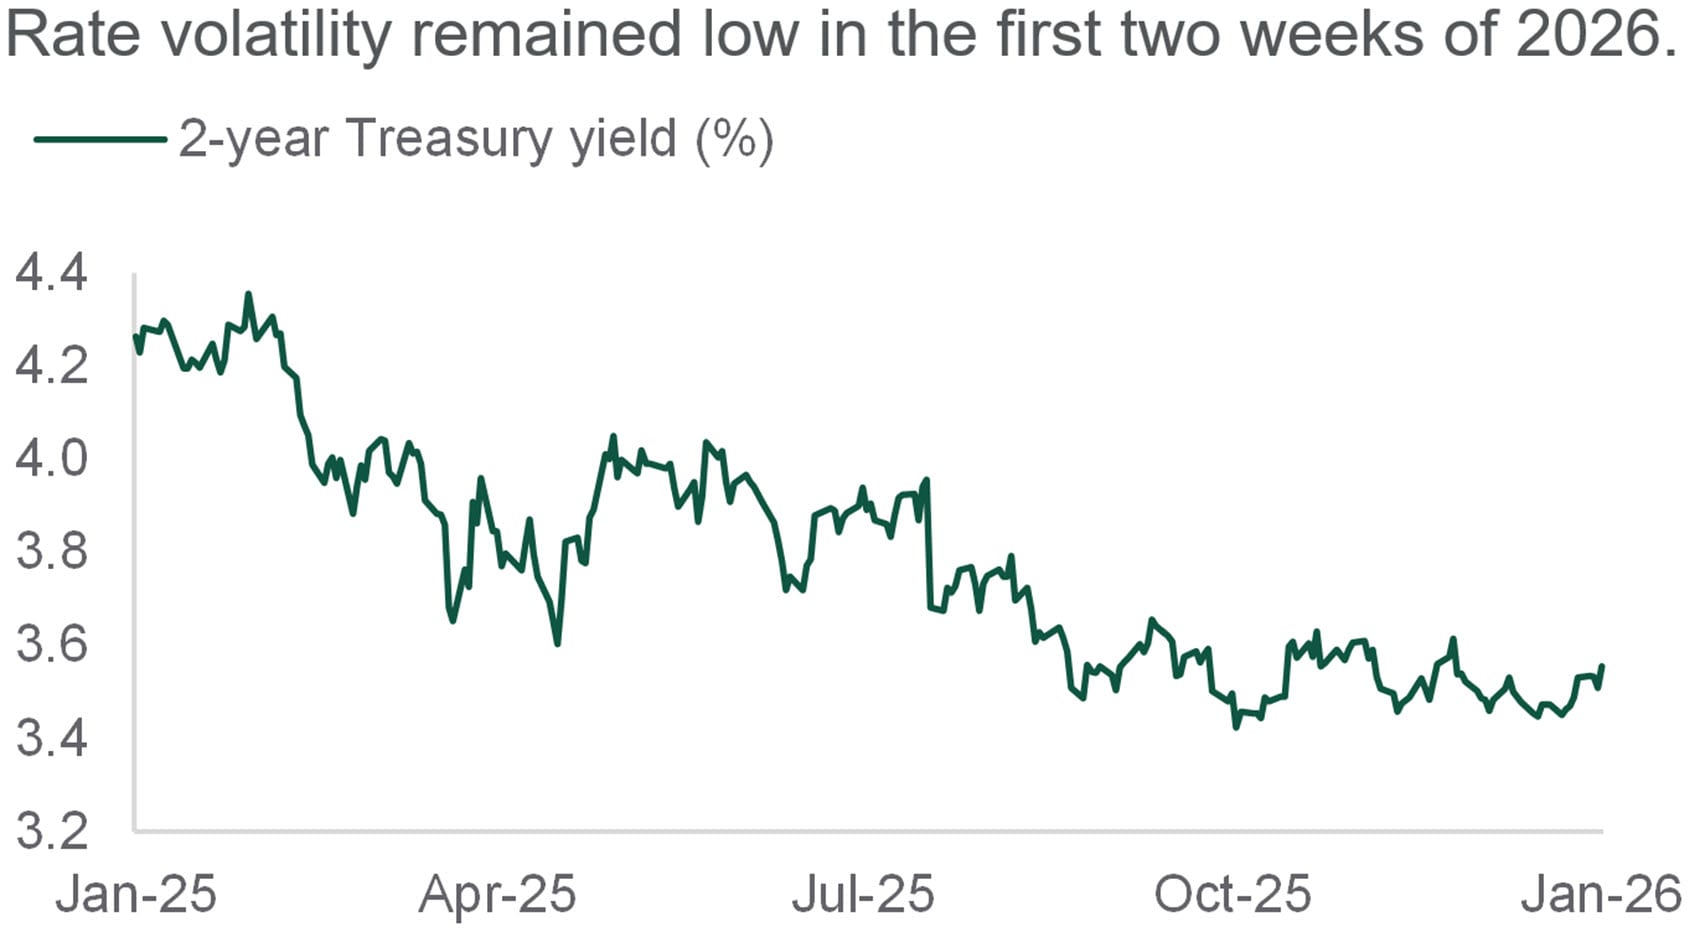
Source: Northern Trust Asset Management, Bloomberg. Data from 1/15/2025 through 1/15/2026. Historical trends are not predictive of future results.
- Futures markets expect two 25-basis-point rate cuts from the Fed in 2026 – we agree as a modal baseline.
- Treasury yields have been range-bound to start 2026; it remains to be seen if that continues during the year.
- U.S. Treasury Department announcements and issuance will be a key watchpoint in 2026.
Credit Markets
Toward the end of 2025, investors debated the path of monetary policy and equity market performance was weighed down by continued discourse surrounding an “artificial intelligence (AI) bubble.” Against this backdrop, high yield bonds outperformed equities in December. Despite the considerable volatility seen in the equity market during the year — from the “tariff tantrum” in April to AI-related weakness in November and December — high yield bonds produced attractive returns driven by income.
As we start the new year, high yield spreads are historically tight. However, dispersion at the bond level has increased throughout the rally. High dispersion implies more opportunity to add value through security selection as opposed to top-down systematic risk factors like credit rating and sector allocation. Elevated dispersion means that there is a wider distribution of underperforming and outperforming names, and it is at the highs of the past 12 months. With spreads at compressed levels, investors seeking to generate alpha may look to CCC-rated credits. However, with record-high dispersion within CCCs, active management and due diligence will likely be paramount to success in this cohort of the market.
— Ben McCubbin and Sau Mui, Co-Heads of High Yield
Value through security selection
Bond-level dispersion has increased within CCCs
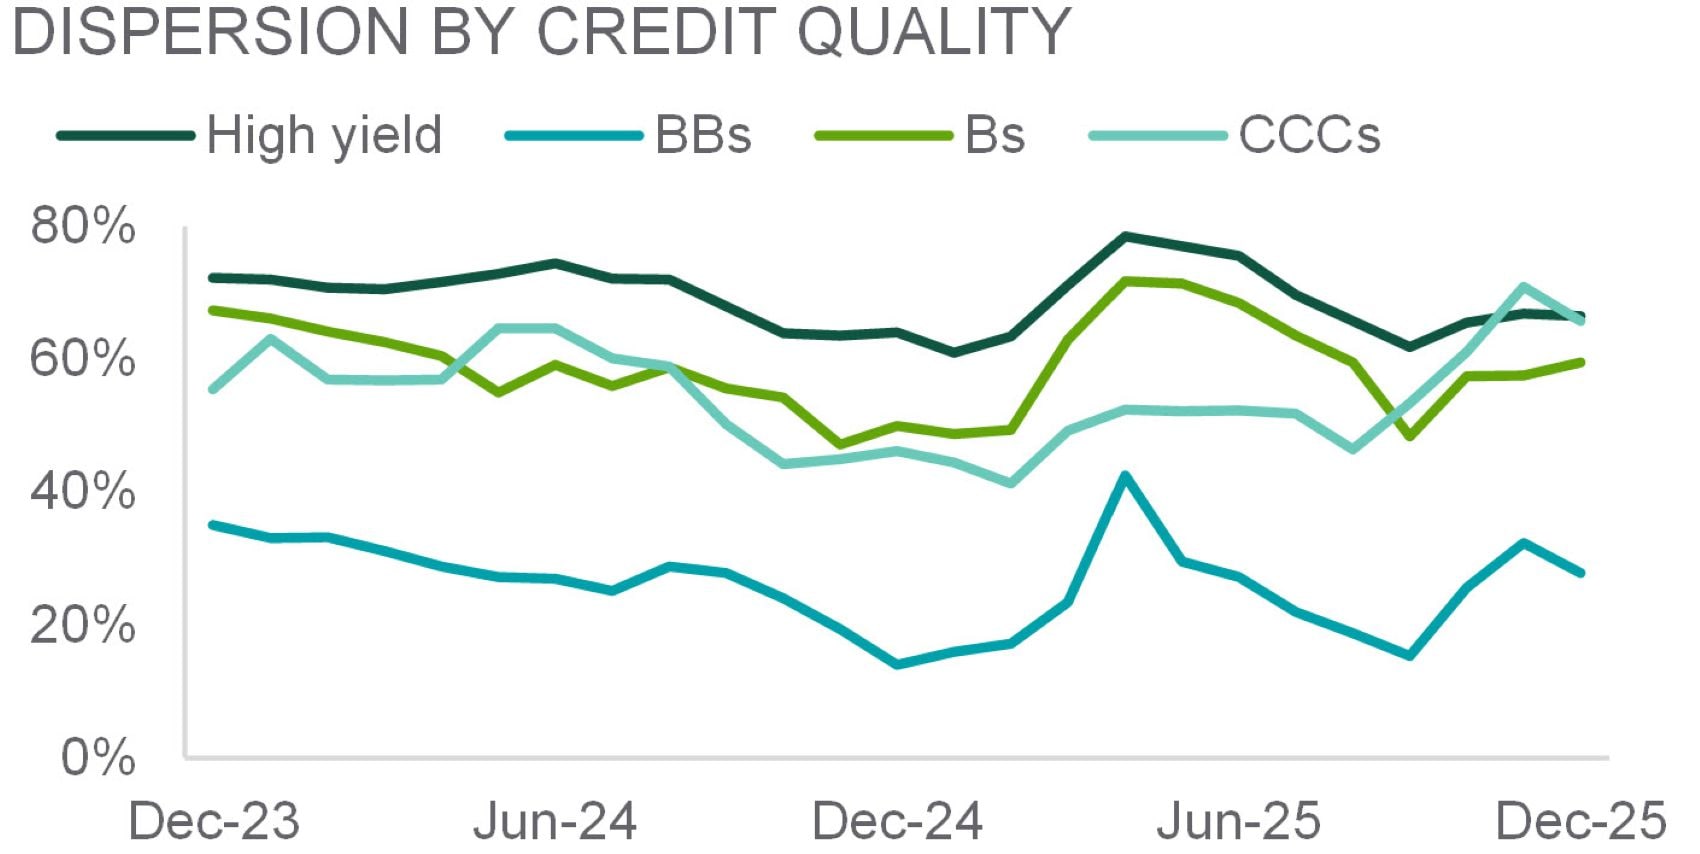
Source: BofA Global Research, ICE Data Indices LLC. Dispersion is measured as the proportion of face value in the index marked outside of: +/-100 basis points (bps) of the overall index for high yield and B-rated credits; +/-75bps for BBs; and +/-400bps for CCCs. Data from 12/31/2023 through 12/31/2025. Historical trends are not predictive of future results.
- High dispersion implies more opportunity to add value through security selection.
- With tight credit spreads, investors seeking to generate alpha may need to look toward low-quality credits.
- With record-high dispersion within low-quality credits, active management and due diligence is key.
Equities
Investors hoping for a year‑end rally were disappointed as U.S. equities stayed rangebound, though the market still eked out an eighth straight monthly gain to finish 2025 up about 18%. Developed markets outside the U.S. rose 3% in December, bringing full‑year returns to more than 30%, aided by a ~10% currency tailwind from dollar weakness. Emerging markets also gained 3%, ending 2025 also up over 30%, anchored by a resilient China equity market and broad country participation. Volatility stayed near year‑lows in December. A steeper yield curve and lower front‑end rates boosted Financials, while having the opposite effect on more rate sensitive sectors. Small caps — after years of underperformance — rebounded into year‑end and to start 2026 as falling rates and rising soft‑landing confidence improved risk sentiment, helping close a performance gap with large caps since the start of 2025.
Macro and fundamental conditions remain supportive. Valuations are elevated, but there has been continued improvement in earnings. Earnings strength spans most sectors, and overall sentiment remains constructive. Our preference for global equities more broadly remains intact.
— Jordan Dekhayser, Head of Equity Client Portfolio Management
False Dawn or Sustained Recovery?
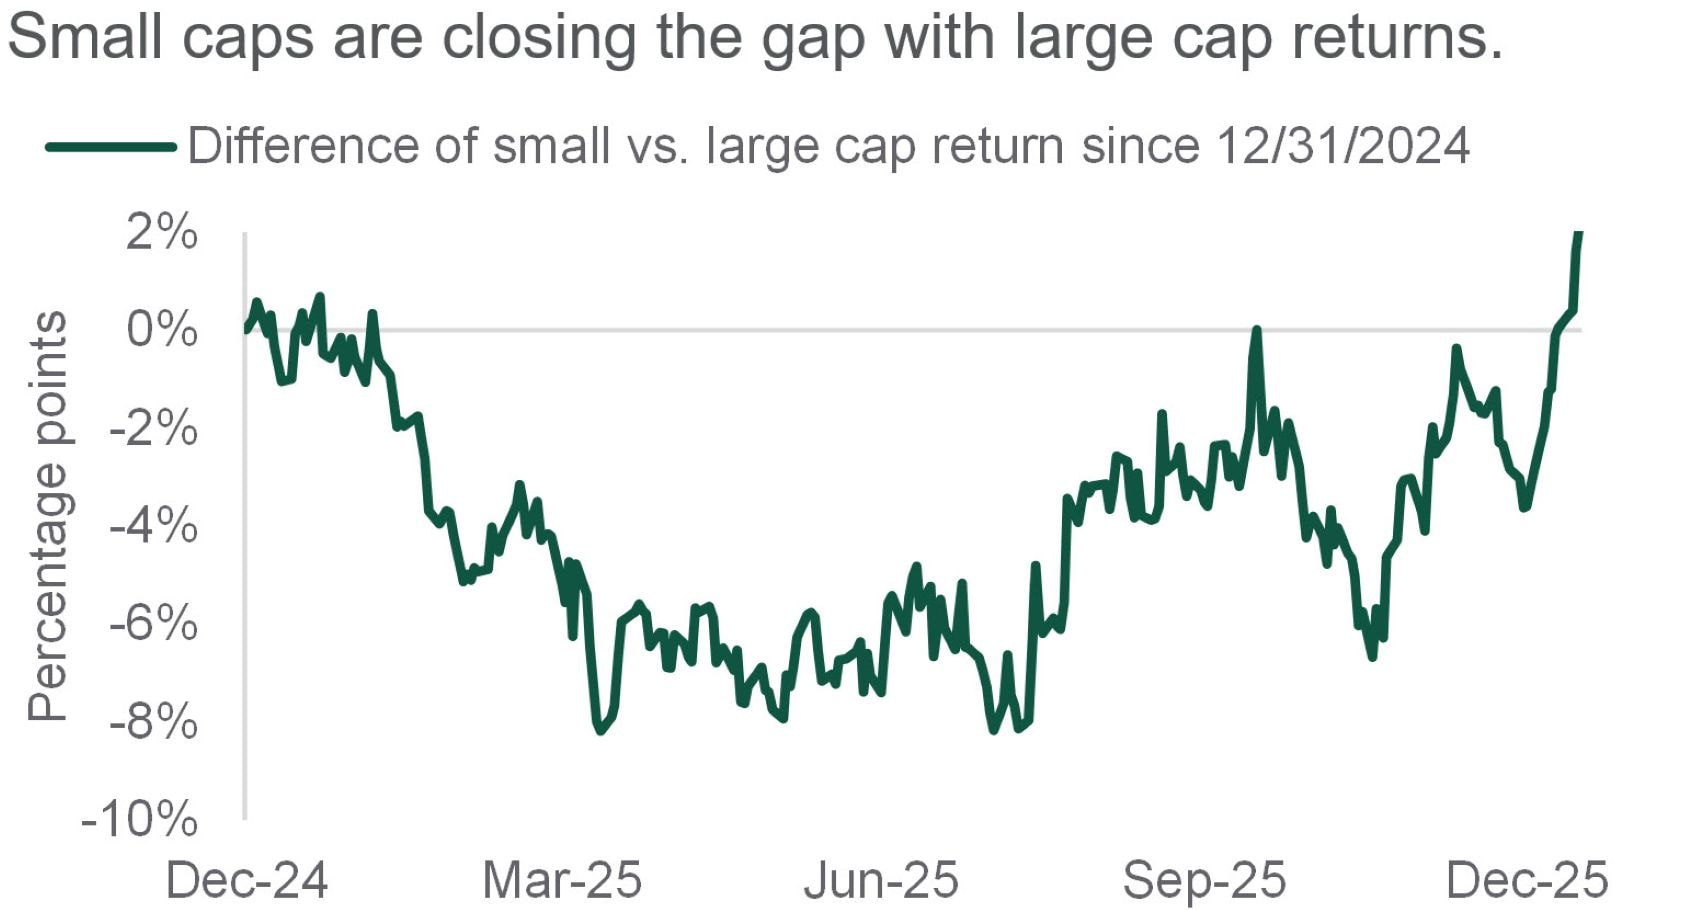
Source: Northern Trust Asset Management, Bloomberg. Percentage point difference in return for the Russell 2000 Index (small caps) minus the Russell 1000 Index (large caps). Data from 12/31/2024 through 1/15/2026. Past performance is not indicative or a guarantee of future results. Index performance returns do not reflect any management fees, transaction costs or expenses. It is not possible to invest directly in any index.
- 2026 begins with small caps looking to build on recent momentum.
- International markets closed a stellar 2025 with a strong December. Non-U.S. equities were up over 30% for the full year.
- Supportive corporate fundamentals keep us constructive on global equities.
Real Assets
Commodity markets were anything but quiet in 2025, with gold delivering a remarkable performance. The precious metal surged 64%, driven primarily by sustained central bank buying – particularly in China – as policymakers looked to diversify reserves and reduce exposure to the U.S. dollar. With retail interest and subsequent ETF inflows joining central banks, the rally reflected a strategic reallocation into what remains a relatively small asset class, implying that these flows may prove durable. Gold’s enduring value and evolving role in portfolios can make it a strategic asset for diversification and stability.
Further, industrial metals broke higher in 2025, including copper. With respect to the commodity, tariffs have played a meaningful role. The reallocation of inventories toward the U.S. in anticipation of tariff measures tightened availability in other regions. Additional sources of demand – potentially linked to secular growth themes such as defense, energy transition, and AI-related infrastructure – appear to be offsetting softness in Chinese demand. On the supply side, disruptions of mines have further tightened market conditions, with several substantial producers facing operational challenges and project delays.
— Jim Hardman, Head of Real Assets, Multi-Manager Solutions
Precious Metals in Motion
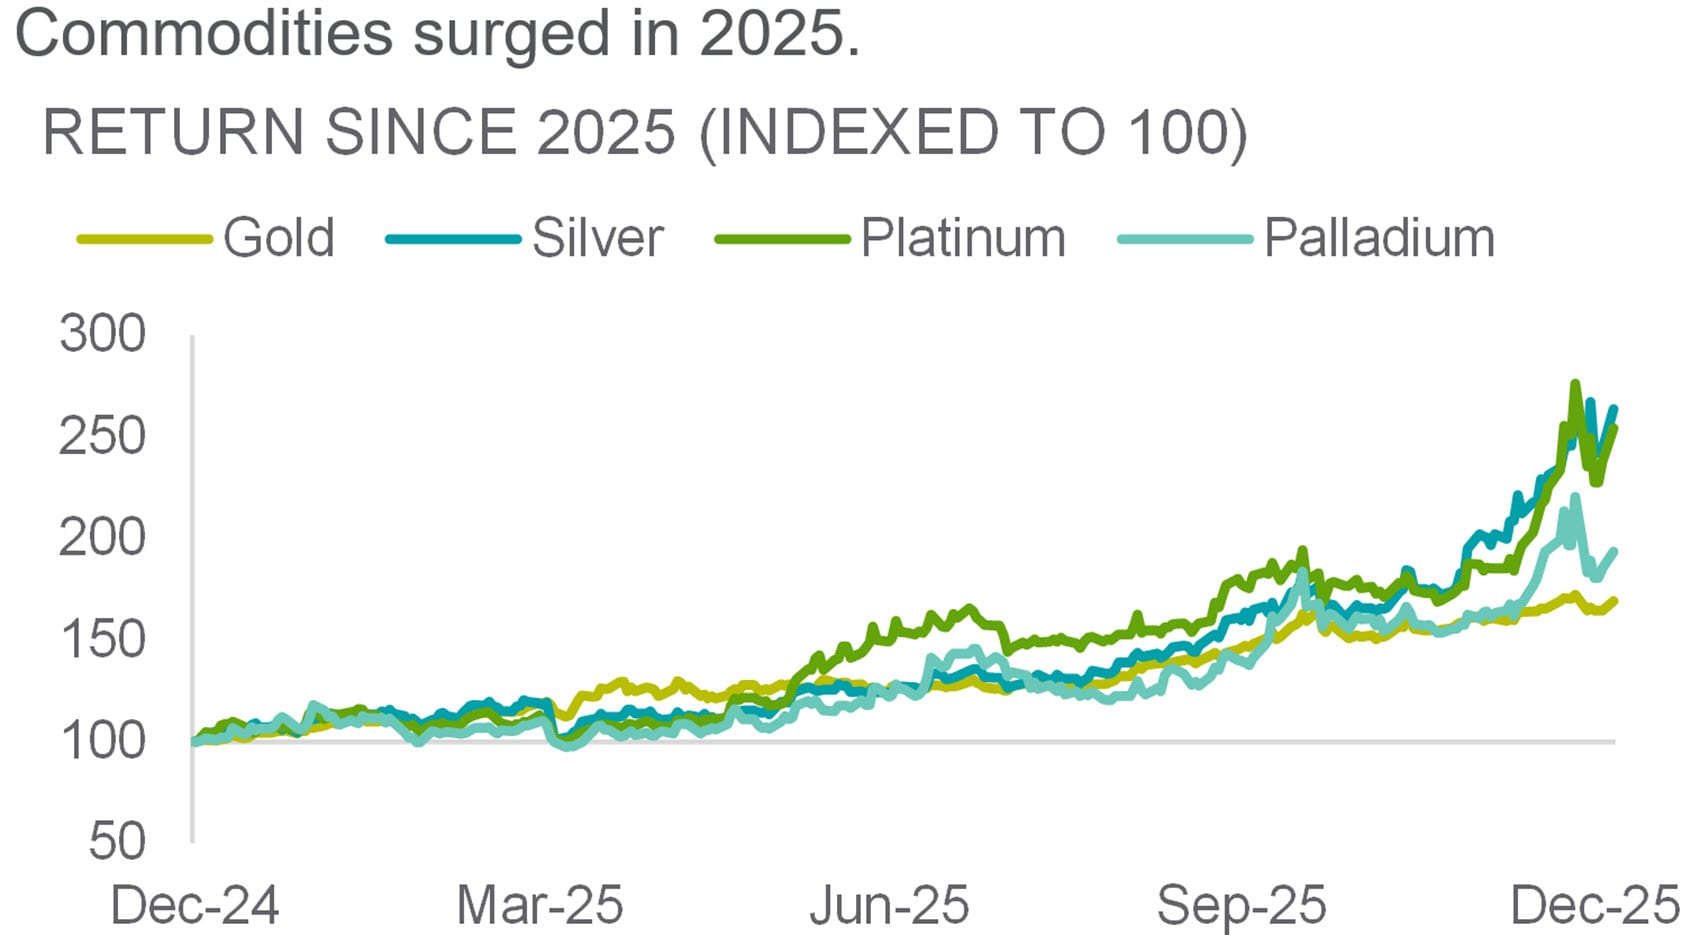
Source: Northern Trust Asset Management, ASR. Data from 12/31/2024 through 1/5/2026. Historical trends are not predictive of future results
- Global utility earnings growth has doubled over the trailing 5 years due to the growth in global power demand.
- Industrial metals joined gold, with copper and others benefitting from secular growth themes.
- We pivoted to a tactical overweight in natural resource equities on compelling fundamentals and accelerating earnings growth.
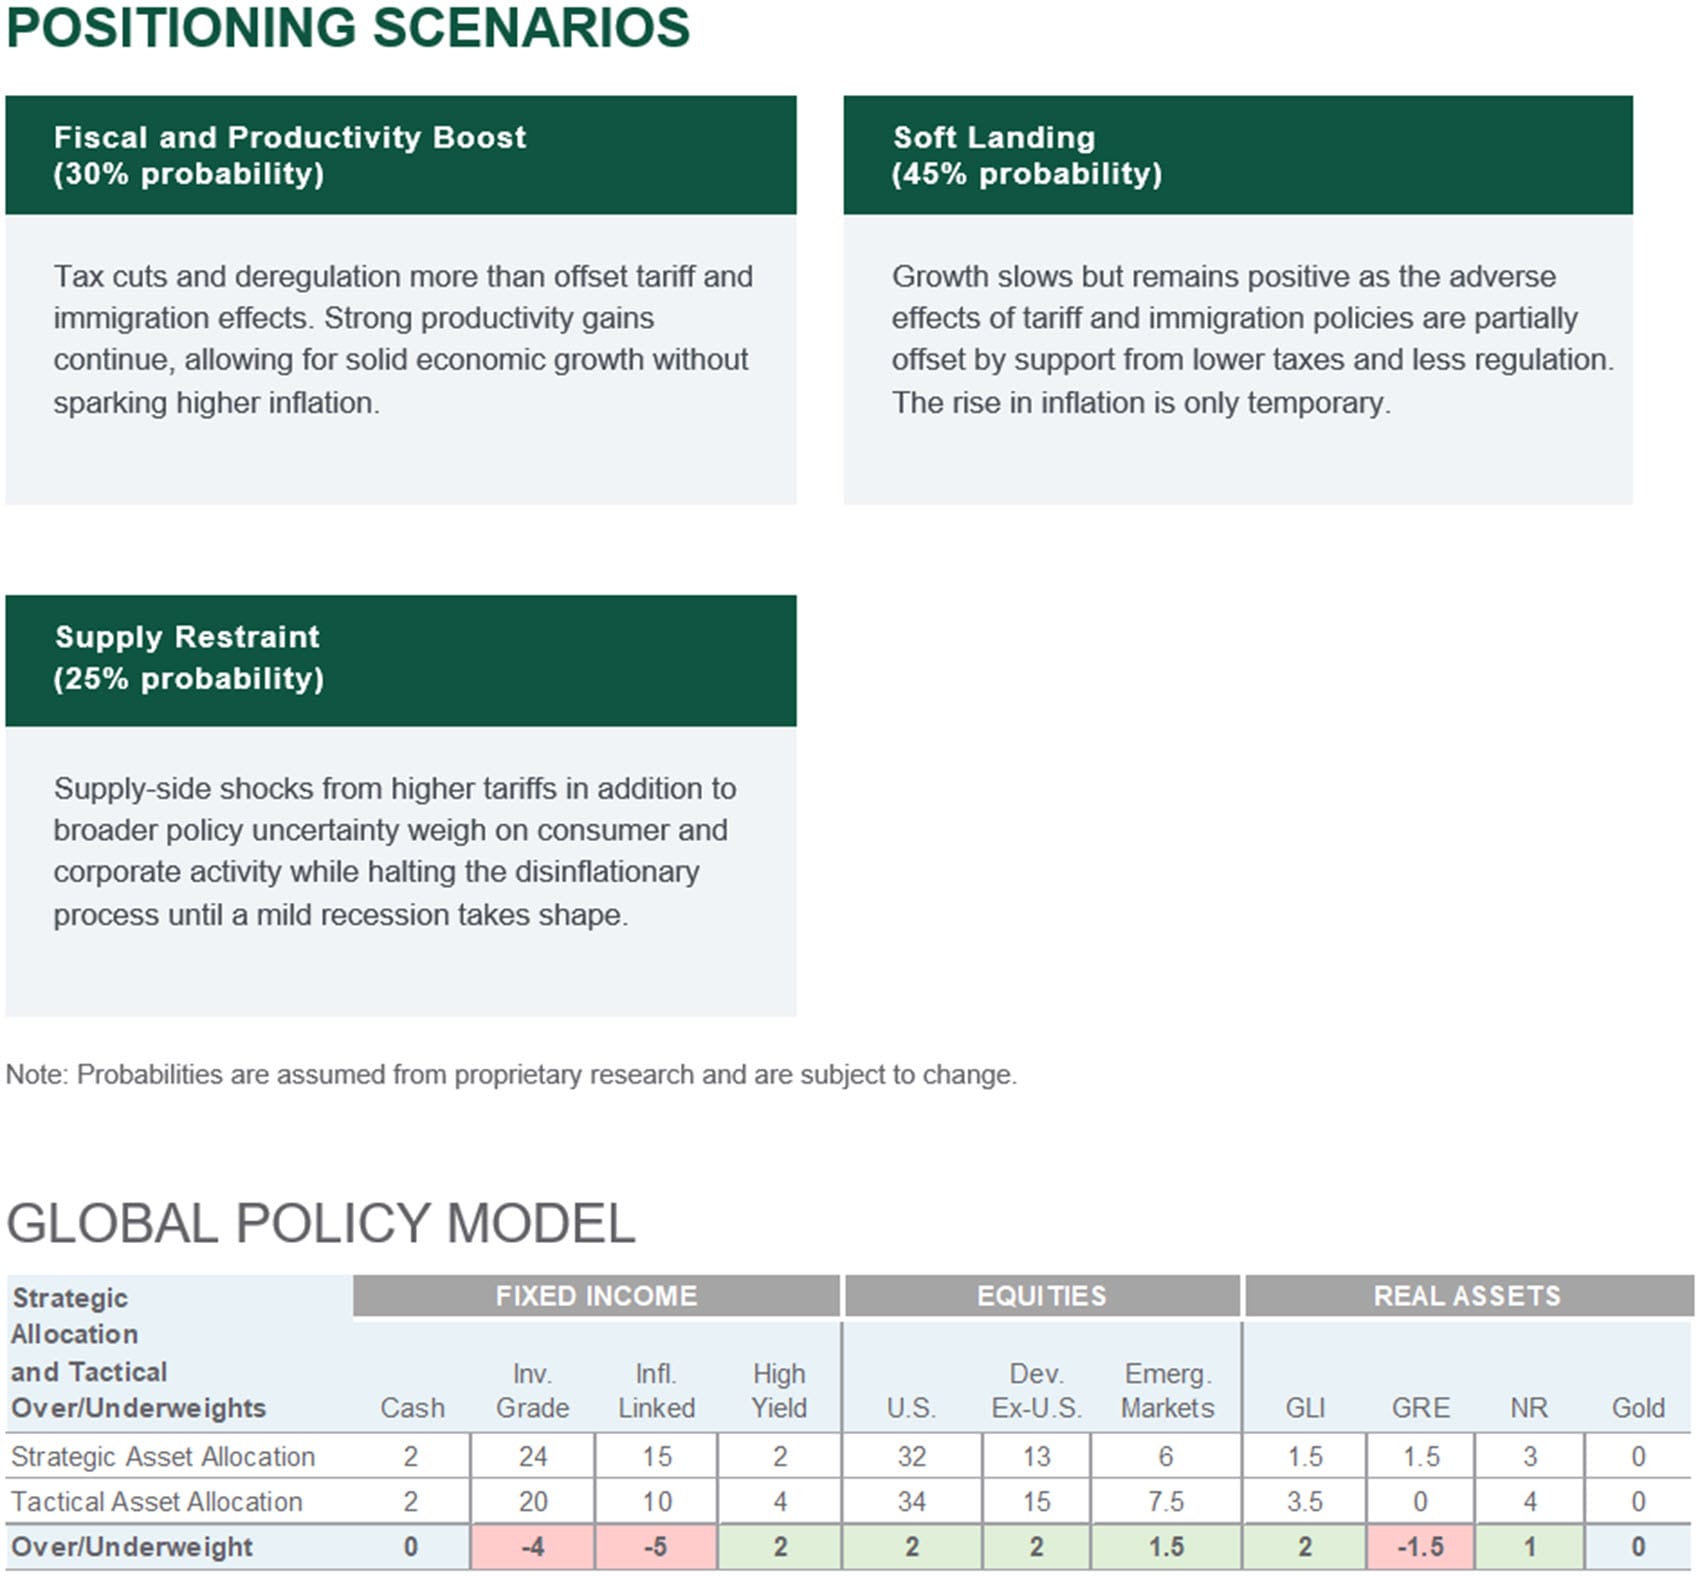
Source: Northern Trust Capital Market Assumptions Working Group, Investment Policy Committee. Strategic allocation is based on capital market return, risk and correlation assumptions developed annually; most recent model released 1/14/2026. The model cannot account for the impact that economic, market and other factors may have on the implementation and ongoing management of an actual investment strategy. Asset allocation does not guarantee a profit or protection against a loss in declining markets. GLI = Global Listed Infrastructure, GRE = Global Real Estate, NR = Natural Resources. Unless otherwise noted, the statements expressed herein are solely opinions of Northern Trust. Northern Trust does not make any representation, assurance, or other promise as to the accuracy, impact, or potential occurrence of any events or outcomes expressed in such opinions.
Unless noted otherwise, data is sourced from Bloomberg as of January 2026.

Contact Us
Interested in learning more about our expertise and how we can help?
{{russell_1000_index}}
{{russell_2000_index}}
IMPORTANT INFORMATION
The information contained herein is intended for use with current or prospective clients of Northern Trust Investments, Inc (NTI) or its affiliates. The information is not intended for distribution or use by any person in any jurisdiction where such distribution would be contrary to local law or regulation. Northern Trust Asset Management’s (NTAM) and its affiliates may have positions in and may effect transactions in the markets, contracts and related investments different than described in this information. This information is obtained from sources believed to be reliable, its accuracy and completeness are not guaranteed, and is subject to change. Information does not constitute a recommendation of any investment strategy, is not intended as investment advice and does not take into account all the circumstances of each investor.
This information is provided for informational purposes only and is not intended to be, and should not be construed as, an offer, solicitation or recommendation with respect to any transaction and should not be treated as legal advice, investment advice or tax advice. Recipients should not rely upon this information as a substitute for obtaining specific legal or tax advice from their own professional legal or tax advisors. References to specific securities and their issuers are for illustrative purposes only and are not intended and should not be interpreted as recommendations to purchase or sell such securities. Indices and trademarks are the property of their respective owners. Information is subject to change based on market or other conditions.
All securities investing and trading activities risk the loss of capital. Each portfolio is subject to substantial risks including market risks, strategy risks, advisor risk, and risks with respect to its investment in other structures. There can be no assurance that any portfolio investment objectives will be achieved, or that any investment will achieve profits or avoid incurring substantial losses. No investment strategy or risk management technique can guarantee returns or eliminate risk in any market environment. Risk controls and models do not promise any level of performance or guarantee against loss of principal. Any discussion of risk management is intended to describe NTAM’s efforts to monitor and manage risk but does not imply low risk.
Past performance is not a guarantee of future results. Performance returns and the principal value of an investment will fluctuate. Performance returns contained herein are subject to revision by NTAM. Comparative indices shown are provided as an indication of the performance of a particular segment of the capital markets and/or alternative strategies in general. Index performance returns do not reflect any management fees, transaction costs or expenses. It is not possible to invest directly in any index. Net performance returns are reduced by investment management fees and other expenses relating to the management of the account. Gross performance returns contained herein include reinvestment of dividends and other earnings, transaction costs, and all fees and expenses other than investment management fees, unless indicated otherwise. For U.S. NTI prospects or clients, please refer to Part 2a of the Form ADV or consult an NTI representative for additional information on fees.
Forward-looking statements and assumptions are NTAM’s current estimates or expectations of future events or future results based upon proprietary research and should not be construed as an estimate or promise of results that a portfolio may achieve. Actual results could differ materially from the results indicated by this information. Historical trends are not predictive of future results.
Northern Trust Asset Management is composed of Northern Trust Investments, Inc., Northern Trust Global Investments Limited, Northern Trust Fund Managers (Ireland) Limited, Northern Trust Global Investments Japan, K.K., NT Global Advisors, Inc., 50 South Capital Advisors, LLC, Northern Trust Asset Management Australia Pty Ltd, and investment personnel of The Northern Trust Company of Hong Kong Limited and The Northern Trust Company.
Not FDIC insured | May lose value | No bank guarantee