The Weekender
- Who We Serve
- What We Do
- About Us
- Insights & Research
- Who We Serve
- What We Do
- About Us
- Insights & Research
Point of View · 11.12.25
Save to bookmarks
Are We in a Stock Market Bubble?
We examine valuations in historical context, how today’s market compare to the tech bubble of the 1990s and what’s driving stock gains now.
- Markets & Economy
- Market & Investment Trends
- Equity Insights
- Risk Management
Format
Change Format: Choose the format you prefer, and we'll remember your preference next time.
Are We in a Stock Market Bubble?
Save to bookmarks
Save to bookmarks
Key Points
Market valuations are elevated, but the current environment differs fundamentally from past bubbles.
Concentration risk remains high, though earnings growth is expected to broaden in 2026.
The rally continues to be supported by strong fundamentals and resilient corporate profitability. While risks are building, there is still meaningful room for this bull market to run.
Assessing Valuations: Context Matters
Global equity markets have climbed to record levels, sparking renewed debate among investors about whether we have entered bubble territory. Concerns over stretched uneven market breadth and softening economic data have all contributed to this narrative. These discussions are important, but they should be grounded in context. Markets rarely move in a straight line, and corrections — while uncomfortable — are a normal, even healthy, part of the investment cycle.
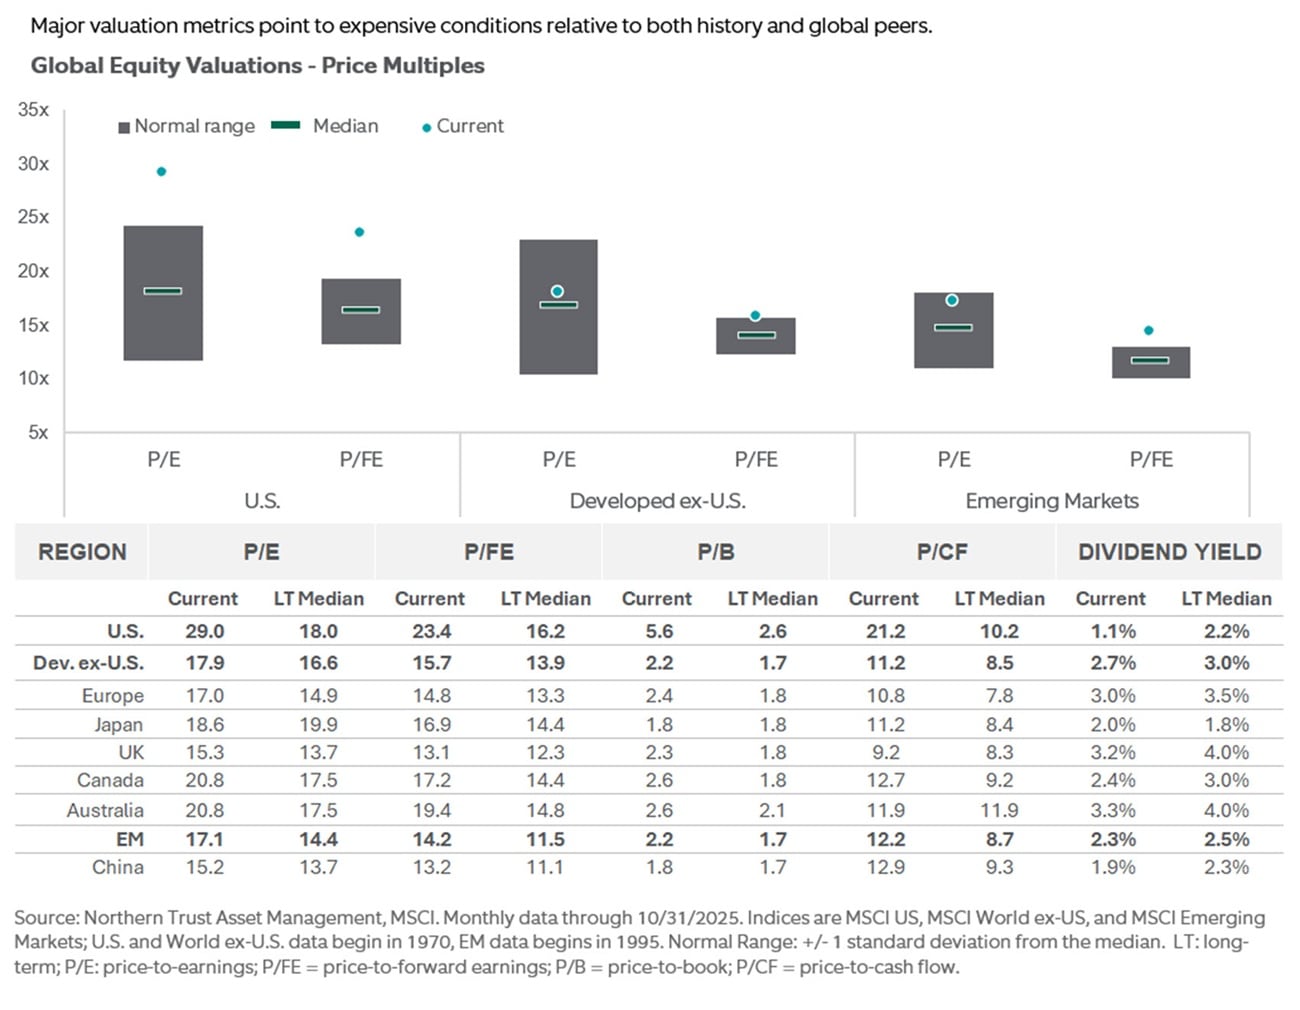
Valuations, as shown in Exhibit 1, are indeed heightened. The and other major valuation metrics point to expensive conditions relative to both history and global peers. However, valuation alone has never been a reliable timing tool. Expensive markets can become more so without a clear catalyst for reversal, just as cheap markets can remain undervalued for extended periods. Investors should instead view valuation as a guide for long-term return expectations rather than a signal for short-term moves.
Exhibit 1: Expensive Conditions
A Changed Market: The Evolution of the Index
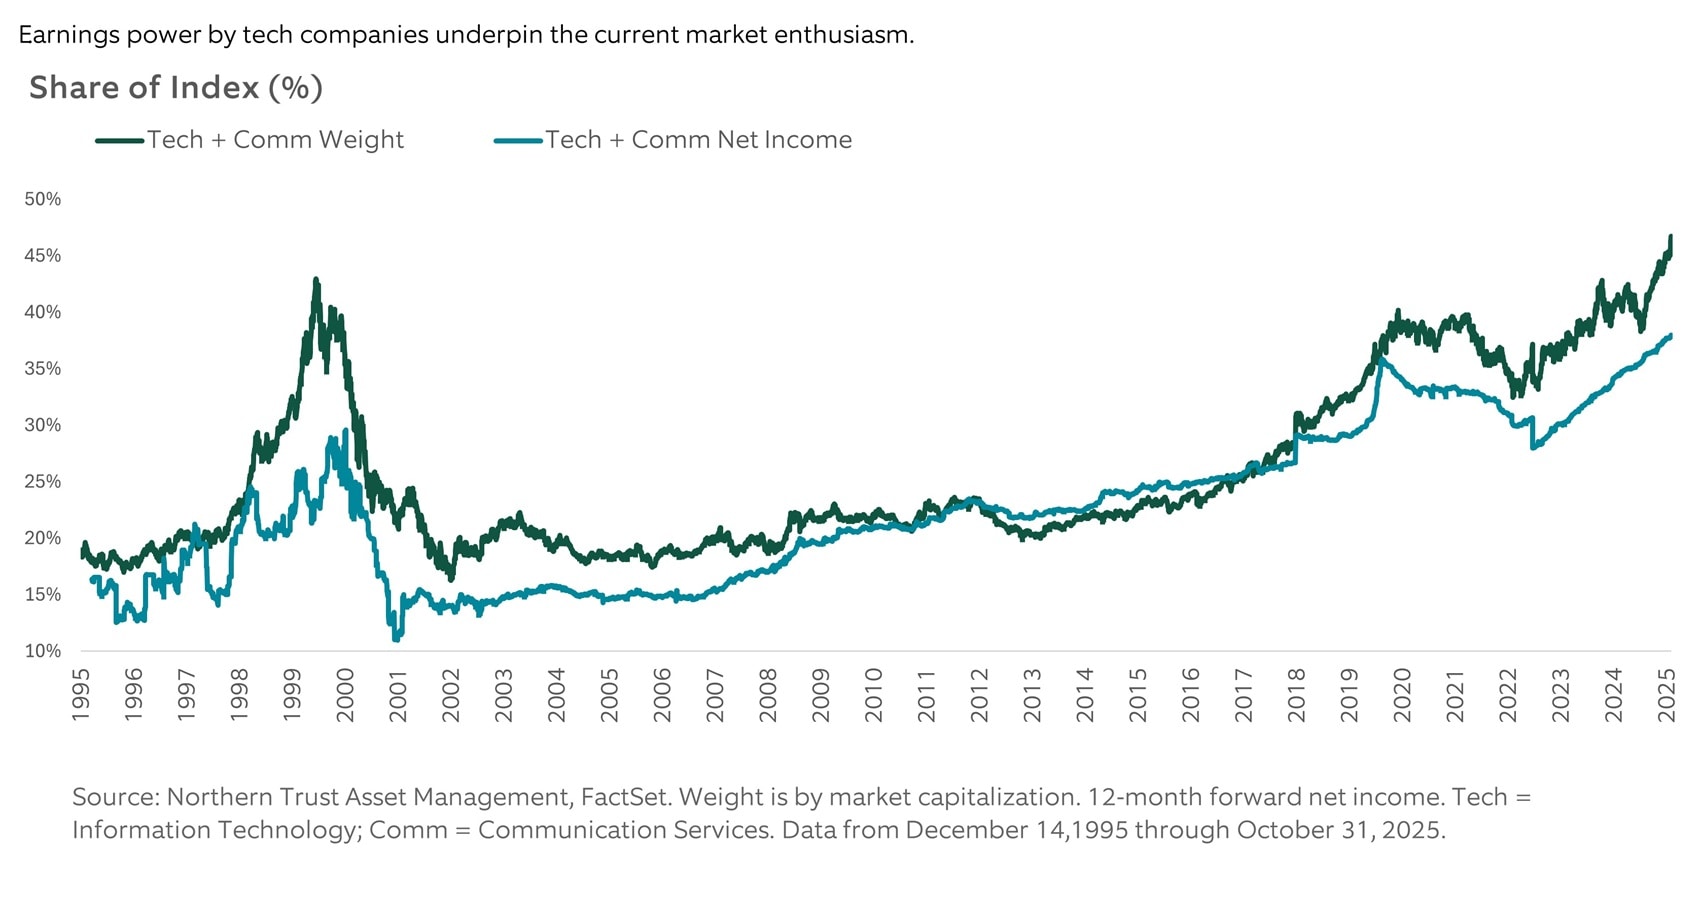
Comparisons between today’s market environment and the late 1990s tech bubble are common, but they often overlook how the composition of the has evolved. Exhibit 2 highlights this shift clearly. While the weight of technology in the index today is similar to that of the late 1990s, the earnings contribution is dramatically different.
During the tech bubble, valuations rested largely on speculative optimism. Today’s technology leaders — the companies driving much of the recent rally — generate substantial profits, robust free cash flow and strong balance sheets. Their business models are grounded in recurring revenue streams, diversified operations and global scale. This distinction matters: The current market enthusiasm, while elevated, is underpinned by demonstrable earnings power.
Exhibit 2: Increasing Tech Weight Backed by Earnings
Concentration and Earnings Power
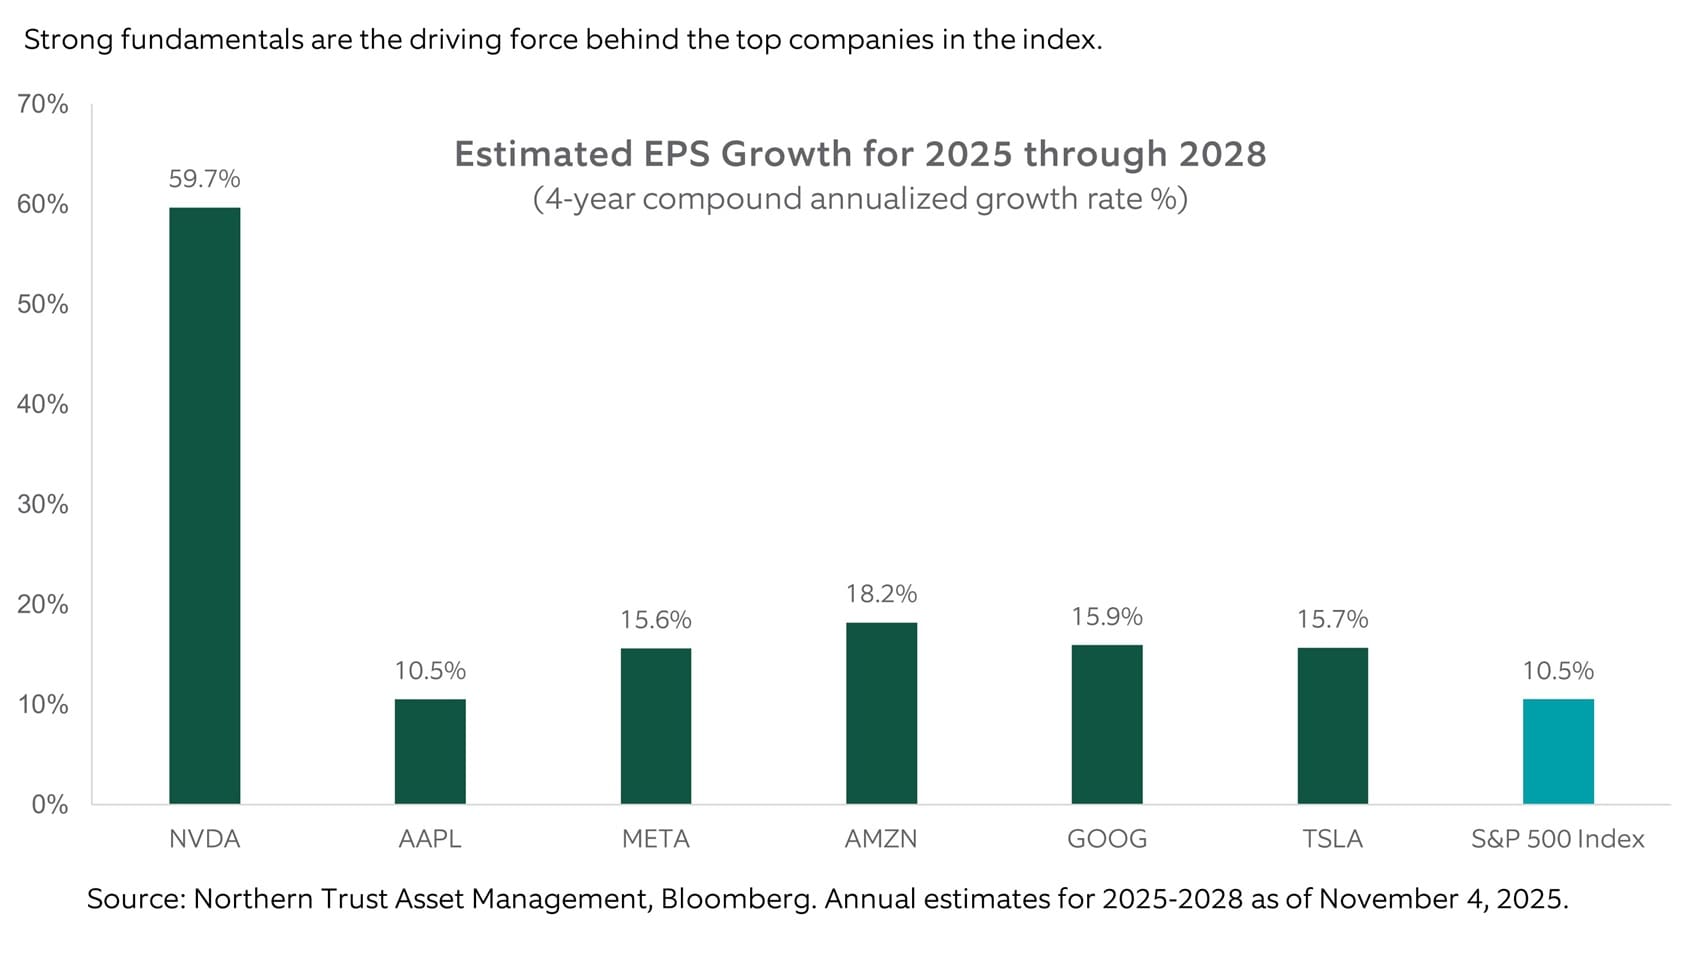
Still, concentration risk cannot be ignored. The top 10 companies have driven over 60 percent of year-to-date market returns, raising legitimate questions about sustainability. That said, Exhibit 3 illustrates the strength of these companies’ cash flow growth relative to the rest of the index, while Exhibit 4 highlights their superior earnings expansion compared with the broader market. In short, their strong fundamentals are the driving force behind their growing dominance within the index.
While heavy concentration poses risk if sentiment toward these leaders shifts, there’s reason for optimism. Earnings forecasts for 2026 suggest a broadening in profit growth beyond the dominant mega-cap names. As other sectors begin contributing more meaningfully, the market’s foundation should become more balanced — potentially reducing volatility and improving durability.
Exhibit 3: Cash Flow Dominance
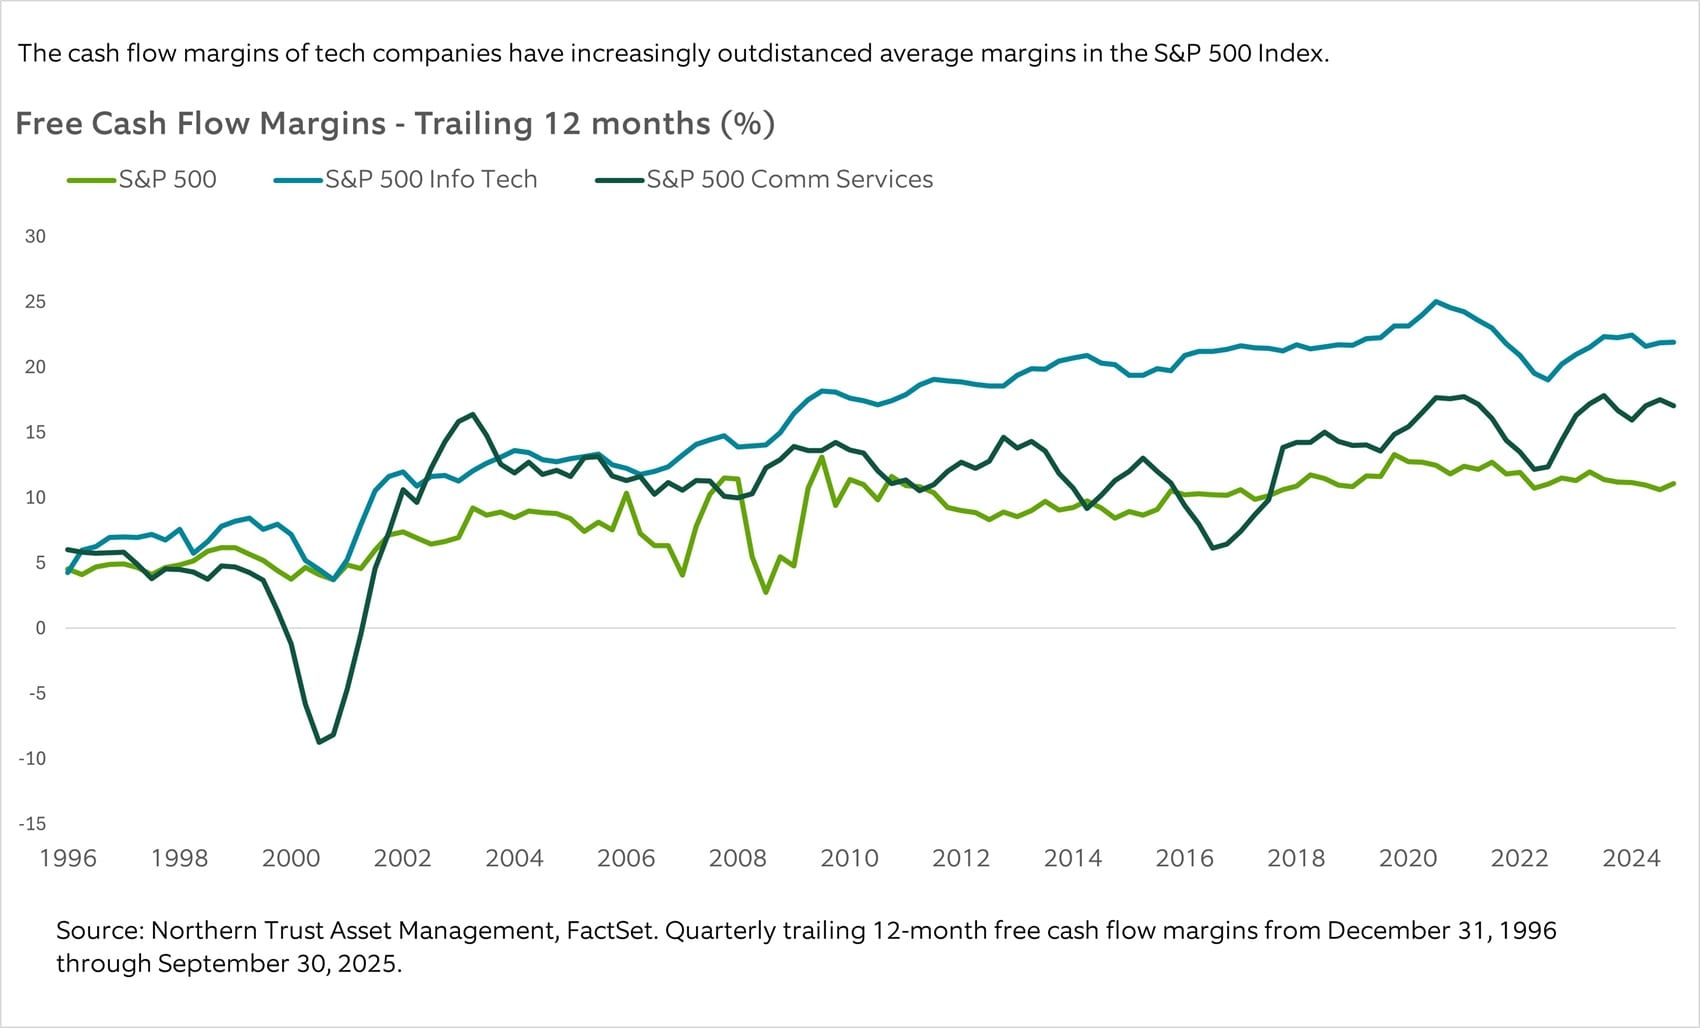
Exhibit 4: Multiples Reflect Expected Growth
The Nature of Bull Markets
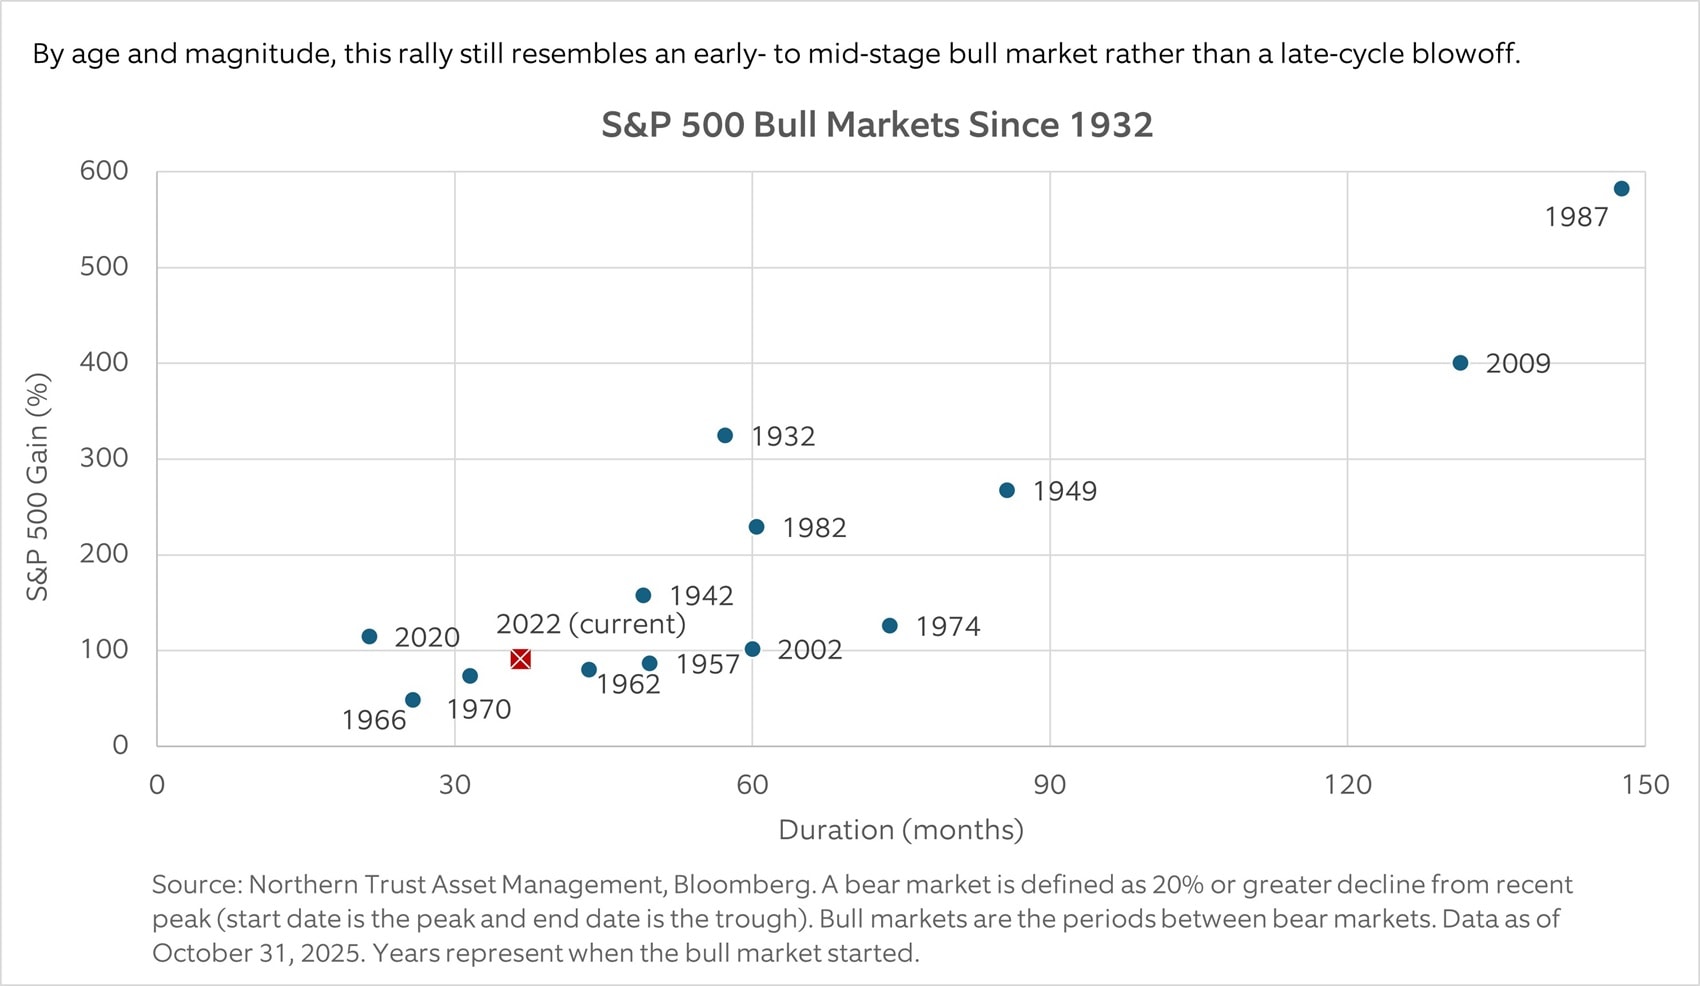
It’s worth remembering that bull markets don’t simply end because they’ve lasted a certain number of years. They typically require a catalyst — monetary tightening, an earnings downturn, or a shock to confidence — to unravel. Exhibit 5 puts the current cycle in historical perspective. By age and magnitude, this rally still resembles an early- to mid-stage bull market rather than a late-cycle blowoff. So far, underlying fundamentals — including earnings strength, solid corporate balance sheets, and steady consumer spending — remain supportive. Moreover, sentiment data suggest that this bull market has not yet been fully embraced by investors, which historically has acted as a positive contrarian indicator.
Exhibit 5: Room for the Bull Market to Run
Looking Ahead: Earnings as the Driver
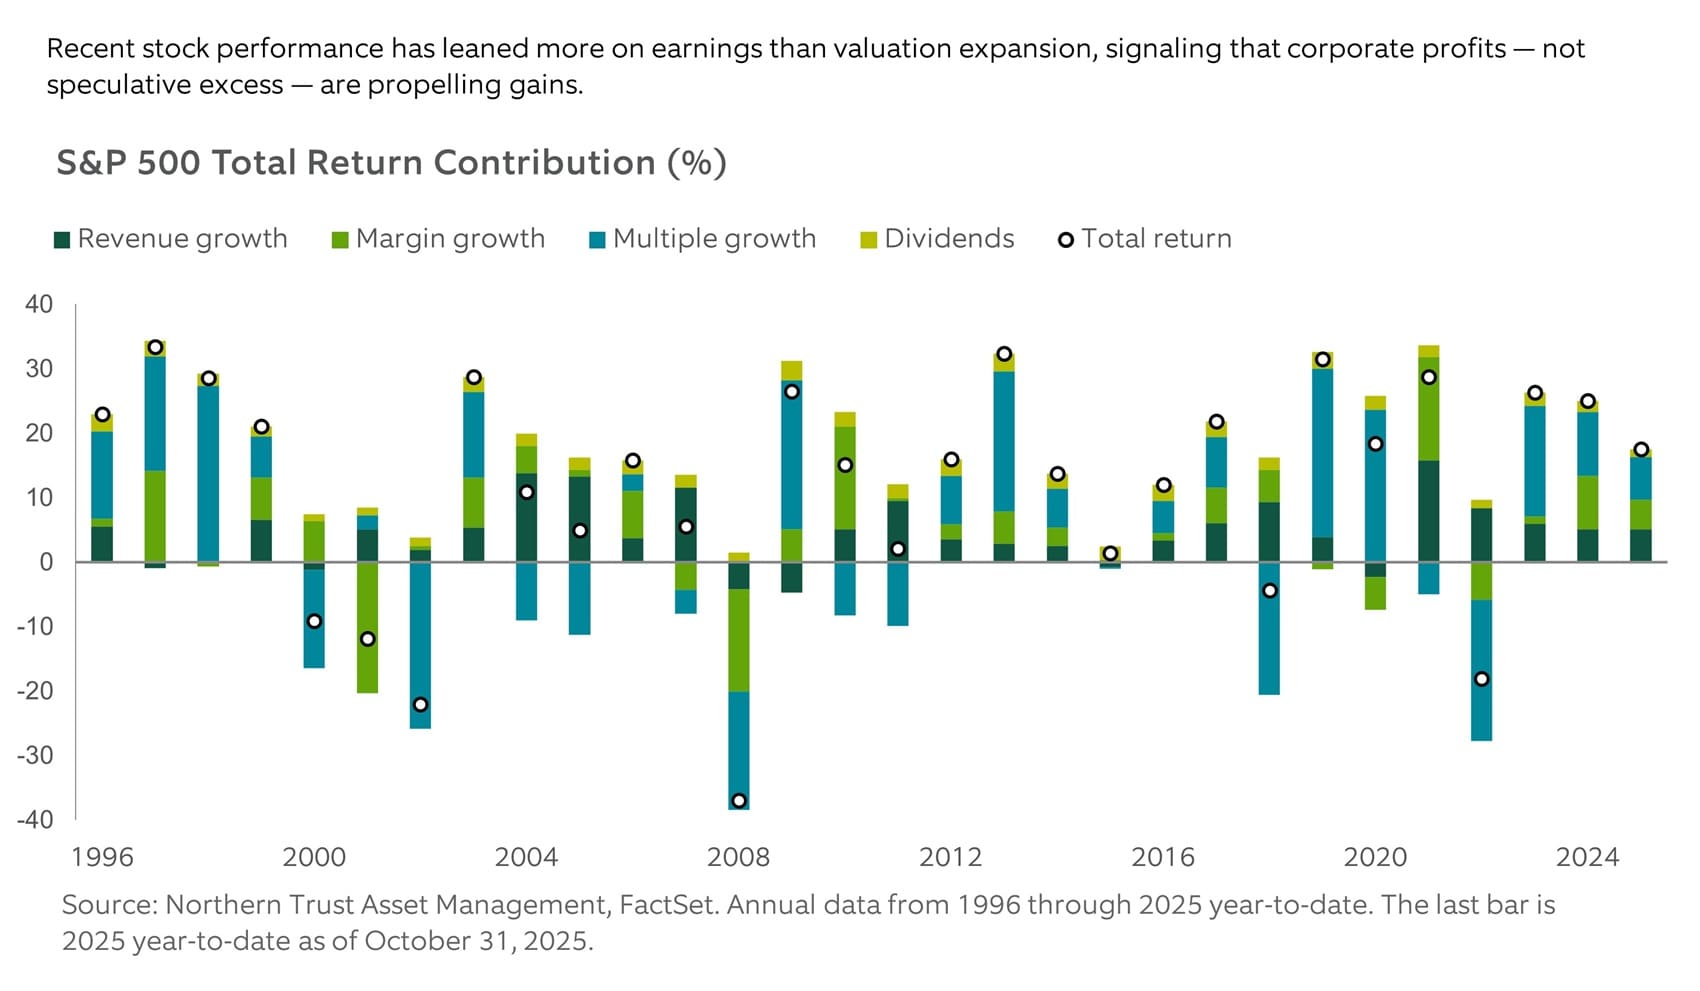
As valuations plateau, earnings growth must shoulder the load for future returns. Exhibit 6 decomposes S&P 500 returns over the past 30 years into contributions from multiple expansion, dividends and earnings growth. The data reveal that recent outperformance has leaned more on earnings than valuation expansion, signaling that corporate profits — not speculative excess — are propelling gains.
Looking forward, the outlook for earnings remains constructive. A resilient corporate sector, ongoing capital investment and a consumer backdrop supported by wealth effects and fiscal stimulus entering the system in 2026 all point to favorable conditions. Meanwhile, the likelihood of less restrictive Federal Reserve policy provides additional support.
Exhibit 6: Earnings Gains
Managing Risk While Staying Constructive
Of course, risks deserve attention. Expanding government and corporate debt levels, the rise in leveraged exchange-traded funds and lofty expectations around artificial intelligence could introduce volatility. Leverage works beautifully in up markets but can deepen losses when volatility returns. Corrections are inevitable — but that should not obscure the bigger picture.
A resilient economy, combined with durable profit growth, provides a strong underpinning for equities. While short-term pullbacks are part of any cycle, the broader outlook points to continued opportunity. Investors who remain disciplined and diversified are positioned to capture those gains over time.
Main Point
Room for the market to run
Despite high valuations and market concentration, current equity gains are driven by strong earnings and fundamentals, not speculation. Risks exist, but investors still can benefit from the durable economic growth that underpins the market.

Contact Us
Interested in learning more about our expertise and how we can help?
IMPORTANT INFORMATION
For Canada, Asia-Pacific (APAC) and Europe, Middle East and Africa (EMEA) markets, this information is directed to institutional, professional and wholesale clients or investors only and should not be relied upon by retail clients or investors. This information may not be edited, altered, revised, paraphrased, or otherwise modified without the prior written permission of NTAM. The information is not intended for distribution or use by any person in any jurisdiction where such distribution would be contrary to local law or regulation. NTAM may have positions in and may effect transactions in the markets, contracts and related investments different than described in this information. This information is obtained from sources believed to be reliable, its accuracy and completeness are not guaranteed, and is subject to change. Information does not constitute a recommendation of any investment strategy, is not intended as investment advice and does not take into account all the circumstances of each investor.
This information is provided for informational purposes only and is not intended to be, and should not be construed as, an offer, solicitation or recommendation with respect to any transaction and should not be treated as legal advice, investment advice or tax advice. Recipients should not rely upon this information as a substitute for obtaining specific legal or tax advice from their own professional legal or tax advisors. References to specific securities and their issuers are for illustrative purposes only and are not intended and should not be interpreted as recommendations to purchase or sell such securities. Indices and trademarks are the property of their respective owners. Information is subject to change based on market or other conditions.
All securities investing and trading activities risk the loss of capital. Each portfolio is subject to substantial risks including market risks, strategy risks, advisor risk, and risks with respect to its investment in other structures. There can be no assurance that any portfolio investment objectives will be achieved, or that any investment will achieve profits or avoid incurring substantial losses. No investment strategy or risk management technique can guarantee returns or eliminate risk in any market environment. Risk controls and models do not promise any level of performance or guarantee against loss of principal. Any discussion of risk management is intended to describe NTAM’s efforts to monitor and manage risk but does not imply low risk.
Past performance is not a guarantee of future results. Performance returns and the principal value of an investment will fluctuate. Performance returns contained herein are subject to revision by NTAM. Comparative indices shown are provided as an indication of the performance of a particular segment of the capital markets and/or alternative strategies in general. Index performance returns do not reflect any management fees, transaction costs or expenses. It is not possible to invest directly in any index. Net performance returns are reduced by investment management fees and other expenses relating to the management of the account. Gross performance returns contained herein include reinvestment of dividends and other earnings, transaction costs, and all fees and expenses other than investment management fees, unless indicated otherwise. For U.S. NTI prospects or clients, please refer to Part 2a of the Form ADV or consult an NTI representative for additional information on fees.
Forward-looking statements and assumptions are NTAM’s current estimates or expectations of future events or future results based upon proprietary research and should not be construed as an estimate or promise of results that a portfolio may achieve. Actual results could differ materially from the results indicated by this information. Historical trends are not predictive of future results.
This information is intended for purposes of NTI and/or its affiliates marketing as providers of the products and services described herein and not to provide any fiduciary investment advice within the meaning of Section 3(21) of the Employee Retirement Income Security Act of 1974, as amended (ERISA). NTI and/or its affiliates are not undertaking to provide a recommendation or give investment advice in a fiduciary capacity to the recipient of these materials, which are for marketing purposes and are not intended to serve as a primary basis for investment decisions. NTI and/or its affiliates may receive fees and other compensation in connection with the products and services described herein as well as for custody, fund administration, transfer agent, investment operations outsourcing, and other services rendered to various proprietary and third-party investment products and firms that may be the subject of or become associated with the services described herein.
Northern Trust Asset Management is composed of Northern Trust Investments, Inc., Northern Trust Global Investments Limited, Northern Trust Fund Managers (Ireland) Limited, Northern Trust Global Investments Japan, K.K., NT Global Advisors, Inc., 50 South Capital Advisors, LLC, Northern Trust Asset Management Australia Pty Ltd, and investment personnel of The Northern Trust Company of Hong Kong Limited and The Northern Trust Company.
Not FDIC insured | May lose value | No bank guarantee